
Thursday, December 8, 2011
EUR/USD - Yet Another Break Lower
More of the same for the Euro this morning. The longer term chart clearly shows a series of consolidations followed by breaks to new lows that have been in place since the beginning of November. Given the political issues in Europe there is no reason to expect we aren't setting up for another move lower as the break under 1.3350 suggests. In fact, a move under 1.3200 could set the stage for a much larger move lower once the early October lows are taken out, targeting as low as 1.2000/1.2200 fairly quickly. I am short on the break under 1.3350.

Wednesday, December 7, 2011
LG Panel Chart Update - Testing Support
LG Panel (LPL) broke out last week and hit a high of 11.78 on Nov 30. It's currently testing the 11.00/11.25 breakout level this morning. If this support holds look for a retest of 11.78 and eventual break to new highs. Target 13.00.


Thursday, December 1, 2011
Chart Industries - Play on LNG Infrastructure
Great fundamental story and great chart setup. Cheniere Energy (LNG) will be spending billions over the next few years to expand LNG export capabilities. Chart Industries (GTLS) will be a big beneficiary. Look for this one to run higher above 63.60.


Tuesday, November 29, 2011
Looking for Shorts in all the Wrong Places?
Sometimes the best time to find a good short opportunity is during a strong up market. If a stock is badly lagging a strong market then the alarm bells in your head should be going off.
Take Cheniere Energy (LNG) for example. The Dow and S&P500 were each up around 3% today. Yet LNG, which initially gapped up in the morning, spent the rest of the day gradually drifting lower. Price initially found support at $10, which was previous support between the 8th and the 11th this month. However eventually this $10 support broke and the stock ended up closing the day down over 3% at 9.89 (-0.32).
I went short LNG today @ 10.14 with a 8.00-8.50 target. The false breakout above 12.50 last week gave me added confidence that the stock was tired and may be poised for further losses. My stop is currently above 10.60 (which gives me about a 3:1 risk/reward). I'll likely lower my stop again after the open tomorrow after I see how the stock opens.
A short position like this works well, particularly when you are otherwise long equities as I am. If the market continue higher then maybe LNG will get dragged higher with them and I'll get stopped. But the loss on this trade will be small relative to the gains in my other long positions. However, if the market turns and starts to head lower, a stock like LNG will almost certainly drop further than the rest of the market providing a decent hedge against potential losses on my long positions.
Futures are already pointing to strong gains ahead of the European open, so we could see LNG pop back above 10 on the Tuesday open, but I would fade that move if we see it keeping my stop above 10.60.

Monday, November 28, 2011
LG Panel Poised For A Breakout
This is one of my favorite plays right now.
Note: LG Panel (LPL) makes the display panels for LCD TVs (and other devices), it is not LG Electronics the electronics manufacturer.
Fundamentally passive display 3DTV panels are gaining huge acceptance over the active types that were originally introduced 1-2 years ago. LG Panel supplies the passive panels to LG and Vizio. According to a recent study, 8 out of 10 consumers prefer passive over active and sales of passive 3DTVs are growing faster than active.
Recent Black Friday #'s suggest continued strong sales of 3DTVs. Recent estimates have been raised and now call for over 22 million 3DTVs to be sold this year with that number rising to 100 million in 2014. Recent 3D hits like Hugo (by Martin Scorsese) are also driving renewed interest in the sector as a whole.
Technically LG Panel's chart looks really strong, consolidating between 9.60 and 11.2, above its 50 day moving average. Look for a break above 11.10 to add to long positions for a test of the 200 day moving average currently @ 13.20.

Thursday, November 24, 2011
SENSIO Technologies Quarterly Loss Narrows
SENSIO's Q1 revenues (for the period Jun11-Aug11) were up over 150% vs the previous quarter. The absolute level of revenue is still small, but many of their business lines are just now starting to generate revenues. Upcoming quarters should see nice growth in all business segments, except maybe for Live3D which will probably won't generate much in the way of revenues in Q2. But starting Q3 we should see Live3D revenues pick up again from the UFC 3D events and then (hopefully) the Olympics later in the year. Possibly other big events as well which have yet to be announced.
The CE (Consumer Electronics) segment should see significant growth over the next couple of quarters as Vizio passive 3DTV sales ramp up. I also hope to hear of new licensing deals in the CE segment in the near future (we should get an update on the CC tomorrow morning).
The VOD business line should be launched over the next few weeks which will add yet another revenue generating segment to the company's arsenal (should get an update on this as well during the CC).
Expenses look to have stabilized. They were up vs. a year ago (due mainly to the Algolith acquisition) but down vs. the prior quarter.
SENSIO generated a net loss of .0185 per share for the quarter vs. a loss of .0306 cents in prior quarter.
I think it's a fairly positive report. The company is in transition from being a one-trick pony (Live3D) in 2010/2011 to one with 4 distinct revenue generating units (once VOD is launched). SENSIO should continue to narrow losses over the next 2 quarters if expenses remain stable, and possibly be in a position to turn a profit 3-4 quarters from now. Significant profits if things go really well (eg. new major licensing deals).
We'll see what the market has to say after the CC tomorrow - but in my opinion the share price remains fundamentally cheap (even after a 46% rise in the stock over the last week) given the huge potential for growth over the coming months and years.
Link to SENSIO's Q1 Earnings Report: http://sensio.tv/pdf/Q1_Results_2011_2012_ANG_Version_finale.pdf
Thursday, November 17, 2011
EUR/USD Hourly Chart
Hourly RSI has worked off oversold conditions. Currently 1.3469. Test of 1.3425 support seems likely. The descending triangle formation and RSI suggest a break lower.


Monday, November 14, 2011
EUR/USD - Ignore the Noise
Ignore the noise and look at the big picture. Even while it may "feel" like the Euro refuses to go down, the weekly chart clearly shows a break of the uptrend that was in place since spring 2010. The subsequent retest of the trendline failed and price has resumed its downward trajectory. Based on this chart we should see 1.2800 by early/mid December.


Thursday, October 27, 2011
The Euro Short - Part 2
In my last post I talked about multiple levels of resistance in the 1.3850 area in the EUR/USD. Since that post the currency pair traded down to almost 1.3650 before bouncing on positive sentiment and short covering. Now that details from the Euro Summit have been made public the market has continued its relief rally and is currently trading back above 1.4000.
Fundamentally the Euro zone is still a mess. The problems in Europe will not be solved overnight, and the "solution" announced last night is far from guaranteed to be successful. The tricky part is that the short EUR/USD trade has been a very crowded lately making it vulnerable to short squeezes as the market drifts higher.
However above 1.4000 I can't ignore the longer-term favorable risk/reward of being short again. Plus now that the details of the European deal have emerged we can finally consider a "sell the news" trade. 1.4017 is the 100 day moving average and the 50% Fibonacci retracement of the entire 1.4940-1.3146 move is 1.4043.
I am short @ 1.4017 and 1.4037 (1.4027 average) ahead of the levels I mentioned above. My initial stop is fairly wide, above 1.4300. The 200 day moving average is 1.4174 which should provide massive resistance should the short squeeze extend beyond current levels. My initial downside target is 1.34-1.35 with a longer-term target of 1.20.

Wednesday, October 12, 2011
EUR/USD - A Tsunami of Resistance Overhead
The EUR/USD has staged an impressive comeback over the past week and a half - rallying over 700 points from low to high over that period. News of Europe coming to an agreement on a plan to tackle their debt crisis was clearly the catalyst behind the move. The large short position in the market also certainly played a role as shorts were reluctantly forced to cover as key resistance levels were taken out.
However, short-term positives aside, Europe is still fundamentally a mess. Just look at the Slovak vote on Tuesday. One small country (out of 17) almost single-handedly derailed the entire process. For reasons like this the Euro has zero chance of ever overtaking the US dollar as the global currency of choice.
Technically there is a tsunami of overhead resistance in the EUR/USD right above current levels. We closed today just under 1.3800 after hitting a high of 1.3834 earlier in the day.
The 1.3850-1.3875 level offers a tsunami of significant resistance that will be very difficult for the currency pair to overtake:
1.3848 - 50% Fibonacci Retracement from the August high to the early October low
1.3850 - Natural "whole number" resistance
1.3869 - 50 day moving average
1.3860/80 - Previous support/resistance levels dating back to February, July and September.
In addition, the 200 day moving average is flattening out, while the 50 and 100 moving averages are both below the 200 day and headed lower.
I have been negative on the EUR/USD for a while. My last post on September 8th suggested getting short on the break below 1.4000 with an initial target of 1.3500/1.3600 (which actually occurred in just 2 days):
EUR/USD Breaches Key Support
I am now short again at an average of 1.3821 (I sold some today at 1.3832 and 1.3810). I am looking for a test back to the 1.3000 level with a longer-term target of 1.2000. Unfortunately I was only filled on 1/3 of a full position - I was also offered at 1.3840 and 1.3860 but price didn't quite get there. My initial stop is above 1.4050 just in case there is a silly short-squeeze pop on a positive headline.

Thursday, September 8, 2011
EUR/USD Breaches Key Support
The EUR/USD currency pair is currently trading at 1.3940 after breaching key support at 1.3980 following Trichet's press conference earlier this morning.
Fundamentally Europe is still a mess and no matter what you think of the USD it has to look better than the Euro. That doesn't mean the USD is out of the woods either, which is why being long gold is probably a good bet here, but the USD is clearly the better of the two currencies.
I have been fundamentally bearish of the Euro for many months, but have been waiting for a technical signal to provide confirmation.
I tweeted my 1.4099 short position last night, which I covered at 1.3954 this morning. I am now short again at an average of 1.4007. The break back below key 1.3980 support suggests much further downside potential here.
Not only is the pair trading below the 1.3980 trendline support, it is also now clearly below its 200 day moving average, as well as the psychological 1.4000 level. There is nothing in this chart that is bullish in my opinion and I think we could see a very quick move down to the 1.3500/1.3600, possible as early as this week. Longer term I think 1.2600-1.2800 is a very natural target.
Any bounce in the EUR/USD should be used as an opportunity to add to shorts now, with a stop above 1.4050 or 1.4100 depending on your level of risk.

Saturday, July 2, 2011
SENSIO Update - Is 3D Really Dead?
SUMMARY
SENSIO is undervalued at current levels. At .45-.50 per share the market is putting zero value on the future growth potential of the company. Short-term price target is .97-1.32 per share with a medium term upside target of 3.60-5.40 per share.
INDUSTRY EVOLUTION
The 3D industry is currently in a transition period Moore refers to as "the chasm" (see Moore's chart below). It is during this period that the industry must improve the user experience to move from the "early adopter" phase to the "early majority" phase.

SENSIO has a number of technologies whose sole purpose is to improve the user experience, including:
- SENSIO Hi-Fi 3D Format
- The existing cable/broadcasting infrastructure is built on 2D.
- Formats such as side-by-side or top/bottom work by putting both the left and right images on to a single frame - effectively halving the resolution. SENSIO Hi-Fi uses a propriety process that results in the final 3D image being virtually identical to the original.
- Consumers don't want to watch low res 3D. Sensio solves this problem by providing them with a HD 3D image identical to the original HD 2D image (i.e., ability to display virtually Blu-Ray quality).
- SENSIO has signed a licensing deals with Vizio to incorporate the SENSIO format in all of their 3DTVs.
- SENSIO Autodetect
- Most existing 3DTVs are unable to recognize the 3D format being transmitted (e.g., side-by-side, SENSIO Hi-Fi, etc). In order to watch the signal in 3D the user must navigate through a series of steps on their remote and manually choose the type of format.
- This can be so complicated that many 3DTV owners can't even figure out how to watch 3D on their 3DTVs (!!). Read a few 3D forums and you'll see what I mean.
- SENSIO Autodetect makes the process seamless by automatically identifying the type of signal being received, whether 2D or 3D, and automatically configuring the 3DTV to decode the signal and display the appropriate image.
- SENSIO Autodetect includes the ability to detect 2D screen menus overlayed on top of 3D images (e.g., DVR or PS3 menus). If you don't already own a 3DTV you probably would never think of this, but just using simple functions like pause or fast forward when watching 3D on most 3DTVs can result in a visual mess on the screen (for example, when the TV assumes your DVR menu is also in side-by-side mode and attempts to convert it to 3D). Good luck trying to access more advanced menu options. Addressing these "little things" can make a HUGE difference in user satisfaction.
- SENSIO S2D Switch
- What if you bought a 3D disc or recorded a 3D program on your DVR but want to watch it in 2D? What if you have more friends over than you have 3D glasses? What if you want to switch to 2D while you are preoccupied with something else? What if you just want to take a break from 3D for a few minutes?
- SENSIO S2D Switch solves all of these issues by allowing the user to switch ANY 3D signal or 3D content to a 2D image with the press of a button.
- SENSIO Video-On-Demand (VOD)
- SENSIO's answer to the current lack of 3D content. Announced partnership with RoxioNow earlier this year.
- One of the largest libraries of 3D content in the world.
- All Vizio 3DTVs have or will have access to this content. As other manufacturers sign on to SENSIO format they will gain access to this content.
- Additional opportunities to re-broadcast or simulcast Live3D events.
FUNDAMENTALS
A year or two ago the 3D hype was at extreme levels following the success of movies like Avatar and the launch of the first 3DTVs. And this extreme bullishness saw SENSIO's shares trade from 40 cents to over 4 bucks in a matter of just a few months.
Now, in 2011, the pendulum has swung fully in the other direction, with numerous headlines last month actually declaring 3D dead. This extreme negativity has helped push the share price back to pre-2010 levels. The fact that the company is significantly stronger than it was in 2009 is being ignored by the market right now. The market is pricing SENSIO shares as if the 3D industry is truly dead and as if SENSIO will never sign another deal in its lifetime.
To invest in SENSIO you have to believe that 3D is here to stay. I firmly believe that. The studios, electronics manufacturers and cinemas have all invested a lot of money in 3D. The technology is much better than it was years ago. 3D gaming is just starting to show potential. And consumers seem to prefer the new passive 3DTVs recently launched by Vizio and LG over the original active 3DTVs still being pushed by Samsung and Sony. The passive 3DTVs use the cheaper/lighter glasses most theaters use (which don't require recharging) and don't suffer from some of the reported flicker and ghosting issues that many active 3DTVs do.
** Update (July 4): According to a study published this month (funded by LG), 80% of consumers prefer passive 3DTVs over active 3DTVs: http://www.stereoscopynews.com/hotnews/history/market-a-trends/1674-consumers-prefer-passive-3dtv-to-active-3d-4-to-1.html
INSIDERS BUYING
Management still owns 20% of the company, and if industry fundamentals had truly taken a turn for the worse you can bet they would have been the first ones looking to lock in their gains. The fact they didn't do this is encouraging and tells me that management is still confident in the future of the 3D industry and in the future of SENSIO.
In fact the only management transactions in the stock this year have been PURCHASES. Management and the board have recently purchased about 130,000 shares at an average price of around .50.
- May 31 - 20,000 shares exercised @ .50 (J. McDonald)
- May 31 - 10,000 shares exercised @ .50 (E. Choquette)
- May 27 - 9,100 shares purchased @ .52 (E. Fortin)
- May 10 - 10,000 shares exercised @ .175 (J. Malo)
- May 10 - 10,000 shares exercised @ .43 (J. Malo)
- May 10 - 40,000 shares exercised @ .44 (J. Malo)
- Apr 28 - 20,000 shares exercised @ .50 (G. St-Pierre)
- Feb 2 - 4,500 shares purchased @ 1.09 (J. Malo)
- Feb 2 - 4,500 shares purchased @ 1.0986 (J. Malo)
FINANCIALS
Year-to-date revenues (Jun10-Feb11) are about $1.2 million, up about 177% vs. the year-ago period.
By the end of this year the company will have revenues coming in from 6 different business lines (many of these revenues just starting or to start by the end of 2011)
- Cinema Live 3D - Technology
- Cinema Live 3D - Content
- Consumer Electronics - Technology (Manufacturers)
- Consumer Electronics - Technoloy (Chip Makers)
- Consumer Electronics - VOD
- Professional & Broadcasting (Technology)

REVENUES
The bulk of the $1.2 million in year-to-date revenues were driven by 3D live events. These revenues can be expected to show modest gains in the future as more and more cinemas license SENSIO technology. To date SENSIO is in over 800 theaters worldwide and growing.
The biggest driver of increased revenues in the near-term should come from Vizio 3DTV sales. It took a long time coming, but Vizio just launched their new passive 3DTVs in May of this year. Starting in fiscal Q4 (Mar11-May11) we should begin to see the initial impact of these sales (Q4 earnings should be released later this month). Q1 (Jun11-Aug11) will be the first full quarter to benefit from the Vizio sales.
In addition, Vizio just announced this past week a number of new lines of 3DTVs that will be launched this fall.
VIZIO Brings Theater 3D™ Technology to All with a Full Lineup of Bright, Flicker-Free 3D HDTVs Including Three 21:9 Cinemawide HDTV Models
The initial launch in May included just the 37-inch, 42-inch and 47-inch models. Between now and the end of the year Vizio is launching a number of new models which include sizes up to 65-inches.
Every one of these Vizio 3DTVs are embedded with SENSIO technology and SENSIO receives a licensing fee for every 3DTV Vizio sells.
LIQUIDITY / BALANCE SHEET
SENSIO's balance sheet is strong, with no debt and $7.2 million in cash (about $0.13/share). Given the current burn rate of about $250k/month the company has enough liquidity on hand to fund current operations for over two years before having to worry about issuing additional shares.
However in an interview just this past month SENSIO's CFO was quoted as saying it is probable the company will be cash flow positive by the end of next year. So it is likely the only reason the company would need to issue additional shares would be to fund additional acquisitions or growth opportunities.
History Note: The company made a great move going to the market in late 2009 when they raised about $10 million in a bought deal at a price of $2.60 per share. As stated above, the company was well aware of the expected "chasm" coming in 2010/2011. They were forward thinking enough to go to the market at a time when expectations and sentiment for the industry were high. As a result, they now have more than enough liquidity to get them through this chasm as the industry prepares to enter its "early majority" phase.
VALUATION
Worst Case Scenario = .62-.84 / share
Base Case Scenario = .97-1.32 / share
Upside Scenario = 3.60-5.40 / share
VALUATION METHODOLOGY
Worst Case Scenario
Revenues for the first 9-months of the fiscal year were $1.2 million, with expectations for the full year to come in around $1.5-1.7 million.
Using an industry average 5-7x revenues as a conservative basis for valuing SENSIO shares suggests an initial valuation of .27-.36 a share after adding back the cash
This initial valuation is based on existing revenues only. That is, if SENSIO were only a Live 3D events company, then you could argue that a fair valuation might be around 30 cents or so (not much below where we are now). But that would be ignoring all of their other business lines that are just starting to, or will soon start to generate revenues. And many of these businesses have the potential to generate significantly more revenues than the Live 3D business.
Going forward, Vizio should start to contribute significantly to revenues. Vizio is currently the largest manufacturer of LCD TVs in North America, with a 21.4% market share vs. #2 Samsung at 16.6% (Sony is way behind at only 8.3%).
Current expectations are for 18.8 million 3DTVs to be sold in 2011 and 36.4 million in 2012. Assuming Vizio can capture a 20% market share that would equate to sales of 7.3 million units in 2012. Assuming licensing revenues of $.50/unit sold would add $3.6 million to SENSIO's revenues in 2012.
Assuming a ZERO increase in existing revenues and ZERO revenues from all of the new business lines mentioned above (conservative!) results in full year revenues of $5.1-5.3 million in 2012. Valuing these revenues at 5-7x results in company valuation of .62-.84 a share after adding back the cash.
I use this .62-.84 / share valuation as my worst case scenario for SENSIO since it includes only existing revenues plus expected Vizio sales.
Base Case Scenario
To come up with a more realistic valuation I should add the expected NPV of the new business lines, such as VOD, and assume a reasonable growth factor for existing business lines. In addition, in my worst case scenario I assume no additional licensing agreements with major TV manufacturers or set-top box manufacturers. Signing a LG and/or a Samsung could add as much as the equivalent of the Vizio impact (i.e., another .35-.48 / share). Just adding this to the worst case scenario would suggest a valuation of .97-1.32 / share. This represents my base case scenario. Recent comments by senior management suggest that ongoing discussions with 1-2 TV manufacturers are going well. I expect to hear news of a new deal within the next couple months, if not sooner.
Upside Scenario
If SENSIO succeeds in becoming the de-facto 3D format standard then all of the above assumptions are way too conservative.
I haven't done enough analysis to properly assess the upside potential in the share price if SENSIO is successful in becoming the 3D standard so I won't try to value such a scenario here.
However about 1 billion display devices were sold worldwide in 2010. Assuming SENSIO was able to achieve a 7.5% penetration rate, that would result in sales of 50 million SENSIO devices. At $.50/unit that gives us $25 million. At 5-7x revenues that would equal a valuation of 3.60-5.40 / share, ignoring all other revenue opportunities (existing and potential). This is obviously a very "ballpark" number but I think it conservatively represents the potential upside in the share price over the medium-term.
For comparison purposes, a recent report by Northland Capital had the following 12-month price targets for SENSIO:
Downside Price: $.50
Target Price: $3.00
Upside Price: $5.00
CHART / TECHNICALS
Last month was a tough one for SENSIO shares. Heavy selling by a large institution that was long from the 2.60 private placement in 2009 was a big factor in slicing the share price in half, taking it from .85 down to .40. SENSIO is a relatively illiquid stock and dumping a million or more shares into the open market over a short period of time is not the smartest way to divest oneself of a position.
That being said, the "panic selling" now appears to be over. Although I added to my long position at .53 and .43 on the way down, I wanted to wait until the floor was in place before writing another update on my blog.
Seasonally, the late summer / fall period has typically been good for SENSIO:
- In 2009 the stock traded between .40-.75 for most of the spring/summer until it finally broke above .75 in August of that year. After breaking out it took just 2 weeks to hit 1.92, and then just another 3 months to hit 4.16.
- In 2010 the stock hit a low of .84 in the early summer and then more than doubled in price to 1.73 by mid-September.
 |
| Weekly Chart (2009-Present) |
How much upside we see this time around will depend on how much new revenues, such as Vizio, impact the bottom line, as well as how successful SENSIO is in signing up new licenses over the next couple of months.
The stock has been in a clear down channel since the beginning of the year. I will be looking for a break above .60/.65 to confirm my view that the low has been put in place and that the next leg higher has begun. But with .13/share in cash the downside is limited. It won't take much in the way of good news to get us back above a buck by the end of the summer and then back to the top of the 1.75/1.80 range by the end of the year.
Friday, July 1, 2011
US Stocks and EUR/USD Both Due For Pullback
US stocks and the Euro saw impressive relief rallies following the Greek votes this week. However technically both are pushing up against strong resistance on the daily charts. As well commodities are weak across the board this am which should put downward pressure on EUR/USD.
We should see at a minimum a nice pullback in each of these today. Whether the pullback will be the start of a larger leg back down remains to be seen. If both trade much above futures overnight highs then my view will be invalidated. But right here looks like great risk/reward shorts in my opinion. I shorted S&P futures at 1316.50 and added to EUR/USD short @ 1.4495 this morning (note S&P futures trade at about a discount to the cash index).
S&P 500 - Cash Index

EUR/USD
 |
Tuesday, June 14, 2011
Time To Buy The Canadian Dollar Again
The fundamentals in Canada US has been weak, numbers out of Canada Canada
As well, expectations are that the Bank of Canada will need to raise interest rates sooner rather than later to remove excess stimulus from the economy. Expectations currently are for Canada Canada
Technically, USD/CAD has been bumping up against .9800 since mid-May. It briefly traded above .9800 on 9 separate days during the past month, but not once has it been able to close above this level. .9800 has clearly become the “line in the sand” for this pair.

However, with today’s close back under the 20 day moving average, I think it’s unlikely we see .9800 again. The ascending trendline that’s been in place since May 1 looks to be breaking today, and with both the MACD and RSI signalling bearish reversals I think it’s time to buy Canada (sell USD/CAD) again here.
The bounce in equities and commodity futures overnight only serve to support the “buy Canada
I am now short USD/CAD @ .9744 looking for an initial move to .9650, with the potential for an eventual re-test of the recent .9450 lows. Above .9770 puts the view at risk, and above .9800 I am wrong.
Wednesday, June 1, 2011
US Long Bonds are a Buy
US Treasury Bonds are a buy here. At least that's what the charts are saying.
As the market focuses on the end of QE2 the chart for US bonds is one of the prettiest I've seen recently. The iShares Barclays 20+ Year Treasury ETF (TLT) is breaking above its 200 day moving average and all signs point to higher prices.
The fact that all the "smart money" has avoided bonds, and many are actually short, this technical breakout could see an acceleration of buying in the near future.
Initial target is the Nov 30 high of 99.27, then 102. The picture looks bullish as long as price holds above its 20 day moving average (currently at 95.54). I tweeted my long entry last week at 96.30 as price started to break above the 200dma.

Friday, April 15, 2011
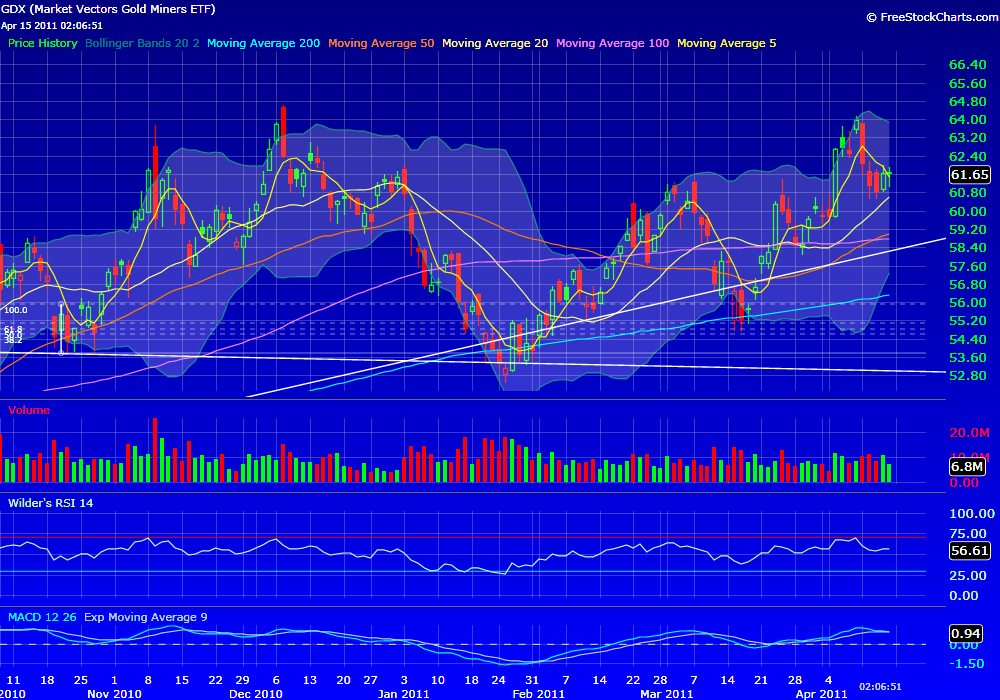
When Will Gold Miners Be Invited To The Party?
With the price of gold hitting new all-time highs on an almost daily basis, you'd have to assume that the gold mining stocks have been performing just as well right? Well, no. The gold miners have definitely been lagging.
The Market Vectors Gold Mining ETF (GDX) is currently trading around the same level it was back in early November, when the price of gold was around 1400. Since then gold has rallied to a high of 1487 today (+6%) and GDX has gone nowhere, not only lagging the gold price, but equity shares in general. The S&P 500 has rallied about 8% over the same period.

I believe that the timing is right for gold mining shares to outperform. Equities keep going up. Earthquakes? Tsunamis? Doesn't matter. Stocks just want to go up.
And there's no indication that the move in gold is anywhere near over just yet.
One could go out and buy the GDX to play an expected rise in gold mining stocks. Alternatively you could pick a few individuals names that you like and buy those instead.
I bought some Barrick Mining (ABX) today. The weekly chart has been slowly coiling and looks ready for a breakout on a move above 55. The other thing I like about Barrick is that they own some oil production as a hedge against mining costs. So oil at 110 won't affect them as much as it might other miners in the sector.

The share price technically could pullback as far as 48.50, but I think the more likely move is to make another attempt at 55. A break of which would open up a move to 75 a share. I am long from 53.50 area and will stop under 48.50. I may look to add to the position on the break of 55 as well.
I am also looking at names like Novagold (NG) and Claude Resources (CGR) as possible plays on a dip.
The Market Vectors Gold Mining ETF (GDX) is currently trading around the same level it was back in early November, when the price of gold was around 1400. Since then gold has rallied to a high of 1487 today (+6%) and GDX has gone nowhere, not only lagging the gold price, but equity shares in general. The S&P 500 has rallied about 8% over the same period.
I believe that the timing is right for gold mining shares to outperform. Equities keep going up. Earthquakes? Tsunamis? Doesn't matter. Stocks just want to go up.
And there's no indication that the move in gold is anywhere near over just yet.
One could go out and buy the GDX to play an expected rise in gold mining stocks. Alternatively you could pick a few individuals names that you like and buy those instead.
I bought some Barrick Mining (ABX) today. The weekly chart has been slowly coiling and looks ready for a breakout on a move above 55. The other thing I like about Barrick is that they own some oil production as a hedge against mining costs. So oil at 110 won't affect them as much as it might other miners in the sector.

The share price technically could pullback as far as 48.50, but I think the more likely move is to make another attempt at 55. A break of which would open up a move to 75 a share. I am long from 53.50 area and will stop under 48.50. I may look to add to the position on the break of 55 as well.
I am also looking at names like Novagold (NG) and Claude Resources (CGR) as possible plays on a dip.
Friday, April 1, 2011
SENSIO 3D - Looking Forward To Q2
Over the last few weeks I've had a number of people ask me to post an update on SENSIO (SIO.V) as we get ready to enter Q2.
Here's a summary of some of the highlights. I won't have time to touch on everything here, so please feel free to email me or post a comment below if you have any questions. (Those new to the company may also be interested in my previous post: Sensio 3D Update: Where Will The Revenue Come From?)
Relationship With VIZIO
Vizio is the largest manufacturer of LCD televisions in North America with about a 28% market share. SENSIO has a very strong relationship with VIZIO. In early 2010 SENSIO and VIZIO signed an agreement to integrate SENSIO's 3D decoder into all of VIZIO's 3D TVs.
However in mid-2010 VIZIO shifted their strategy away from active shutter 3D TVs toward passive 3D TVs (passive 3D TVs use the same affordable glasses used in most 3D movie theaters).
This shift in strategy I believe delayed the launch of many of VIZIO's 3D TVs. It was not until just very recently that VIZIO launched their new lineup of passive 3D TVs to very strong reviews. Initial indications are that the TVs are selling very well. And every TV sold has SENSIO Hi-Fi 3D technology in it.
Not only is VIZIO a leader in 3D TVs, they are also a leader in interconnected TVs. That is another area where SENSIO is expected to benefit. VIZIO's 3D TVs have the capability to connect directly to SENSIO's 3D Video On Demand service, providing potential new revenue streams for SENSIO while at the same time supplying consumers with 3D content that has up until now been lacking.
SENSIO Autodetect And S2D Switch
SENSIO Autodetect automatically detects the type of signal being sent to the TV (2D or 3D, as well as the type of 3D signal - side-by-side, top-and-bottom, Sensio Hi-Fi) without requiring the viewer to manually adjust his or her TV. Currently most 3D TVs require the user to determine what signal is being sent, and then manually choose that format via menu selections on the remote.
I own a Sony 3D TV, and while the picture is great the constant need to use the remote to switch back and forth between formats is a huge pain. It's confusing enough that nobody else in my house actually knows how to use the 3D functions on the TV.
The Autodetect solves this problem, and SENSIO owns the patent on the technology.
Apparently both Samsung and Panasonic are currently using there own versions of autodetect which may infringe on SENSIO's patent. Instead of taking an aggressive approach and threatening to sue the manufacturers, SENSIO is reportedly working with each of them (and others) to not only license the autodetect feature, but to bundle the autodetect with SENSIO's entire line of technologies (including SENSIO Hi-Fi 3D and SENSIO S2D Switch). These discussions are apparently in "very advanced" stages. I expect to hear announcements of new deals being signed this quarter.
This article in the Financial Post provides a nice overview of how SENSIO can help to simplify the whole 3D experience for consumers.
Balance Sheet And Funding Requirements
This is another area where SENSIO was very smart. Although already in a strong financial position, management at SENSIO knew that it would take time for 3D in the homes to catch on in a big way. To make sure they had sufficient working capital to sustain them over this period SENSIO went out and raised over $10 million in Dec 2009, issuing additional shares at $2.60/share.
SENIO's current burn rate is approximately $250,000/month. Even at that rate the company has more than enough liquidity to last them over 2 years before they would potentially need to go to market again. This of course ignores any increase in revenues and further positive developments at the company.
With the new line of VIZIO 3D TVs just being launched, upcoming Live3D events, recent and future licensing agreements, etc., SENSIO should have no liquidity concerns for the foreseeable future. SENSIO's solid balance sheet should be a big asset as it transitions from a concept/development company to a revenue generating company. The fact that they did the financing at $2.60/share is a huge bonus.
Live3D Events
This is an area where SENSIO's compression technology really shines. Broadcasting of live 3D events (such as FIFA, NBA, etc) must be done using the existing 2D infrastructure.
Existing spatial compression methods, such as side-by-side, send the left eye image to half of the screen and the right eye image to the other half. When the signal is received each half must then be stretched to fit the entire screen, reducing the resolution by 1/2. The result is a noticeably lower quality picture compared to the original.
What SENSIO does is compress and decode the signal, using their patented SENSIO Hi-Fi 3D technology, in a way that results in virtually zero noticeable picture loss, even when transmitted across existing 2D infrastructure.
This is why SENSIO is the leader in this area and was chosen to broadcast FIFA World Cup to 1,000 screens worldwide last year, and then chosen to broadcast numerous NBA games this year. This segment could see tremendous growth over the next couple of years, especially if the broadcasters are able to work out a revenue sharing deal with the television networks in the US.
Also In Q2...
What can I say? The share price has been a big disappointment so far this year.
Fundamentally I think the stock is a steal right here. The price isn't really much higher than it was a couple years ago - before Avatar was released, before 3D TVs were being produced, before live 3D sporting events were being broadcast in cinemas worldwide, before the successful $10 million financing, before SENSIO signed its agreement with VIZIO and before SENSIO introduced new patented technologies like Autodetect and S2D Switch.
Why this company is currently trading under a dollar I have no idea. The handful of analysts that cover the stock currently have 1-year price targets that range between 2.25 and 4.20 per share. Union Securities has also suggested that SENSIO is a potential takeover target. At under a dollar I could definitely see someone like RealD or even VIZIO looking to take them over at a bargain price.
Technically, today's closing price of .86 is just 2 cents shy of the 52-week low of .84. So far this .84-.86 has provided decent support, and if this level holds it could form the basis for a very strong double bottom.
If .84-.86 breaks then we could see a move down to as low as .70-.75 in the short-term. The fundamentals don't support a move lower in my opinion, but I can't rule it out. The stock is very illiquid and a few large sell orders could easily push the price lower. The flip-side, of course, is that once we hear some positive developments the price could just as easily jump by 40-50 cents with a few large buy orders.
My year-end target for the stock is 2.60-2.70, assuming we get some positive developments in Q2. Longer term, with a market cap of under $50 million, I think SIO.V has the potential to go much higher.

Here's a summary of some of the highlights. I won't have time to touch on everything here, so please feel free to email me or post a comment below if you have any questions. (Those new to the company may also be interested in my previous post: Sensio 3D Update: Where Will The Revenue Come From?)
Relationship With VIZIO
Vizio is the largest manufacturer of LCD televisions in North America with about a 28% market share. SENSIO has a very strong relationship with VIZIO. In early 2010 SENSIO and VIZIO signed an agreement to integrate SENSIO's 3D decoder into all of VIZIO's 3D TVs.
However in mid-2010 VIZIO shifted their strategy away from active shutter 3D TVs toward passive 3D TVs (passive 3D TVs use the same affordable glasses used in most 3D movie theaters).
This shift in strategy I believe delayed the launch of many of VIZIO's 3D TVs. It was not until just very recently that VIZIO launched their new lineup of passive 3D TVs to very strong reviews. Initial indications are that the TVs are selling very well. And every TV sold has SENSIO Hi-Fi 3D technology in it.
Not only is VIZIO a leader in 3D TVs, they are also a leader in interconnected TVs. That is another area where SENSIO is expected to benefit. VIZIO's 3D TVs have the capability to connect directly to SENSIO's 3D Video On Demand service, providing potential new revenue streams for SENSIO while at the same time supplying consumers with 3D content that has up until now been lacking.
SENSIO Autodetect And S2D Switch
SENSIO Autodetect automatically detects the type of signal being sent to the TV (2D or 3D, as well as the type of 3D signal - side-by-side, top-and-bottom, Sensio Hi-Fi) without requiring the viewer to manually adjust his or her TV. Currently most 3D TVs require the user to determine what signal is being sent, and then manually choose that format via menu selections on the remote.
I own a Sony 3D TV, and while the picture is great the constant need to use the remote to switch back and forth between formats is a huge pain. It's confusing enough that nobody else in my house actually knows how to use the 3D functions on the TV.
The Autodetect solves this problem, and SENSIO owns the patent on the technology.
Apparently both Samsung and Panasonic are currently using there own versions of autodetect which may infringe on SENSIO's patent. Instead of taking an aggressive approach and threatening to sue the manufacturers, SENSIO is reportedly working with each of them (and others) to not only license the autodetect feature, but to bundle the autodetect with SENSIO's entire line of technologies (including SENSIO Hi-Fi 3D and SENSIO S2D Switch). These discussions are apparently in "very advanced" stages. I expect to hear announcements of new deals being signed this quarter.
This article in the Financial Post provides a nice overview of how SENSIO can help to simplify the whole 3D experience for consumers.
Balance Sheet And Funding Requirements
This is another area where SENSIO was very smart. Although already in a strong financial position, management at SENSIO knew that it would take time for 3D in the homes to catch on in a big way. To make sure they had sufficient working capital to sustain them over this period SENSIO went out and raised over $10 million in Dec 2009, issuing additional shares at $2.60/share.
SENIO's current burn rate is approximately $250,000/month. Even at that rate the company has more than enough liquidity to last them over 2 years before they would potentially need to go to market again. This of course ignores any increase in revenues and further positive developments at the company.
With the new line of VIZIO 3D TVs just being launched, upcoming Live3D events, recent and future licensing agreements, etc., SENSIO should have no liquidity concerns for the foreseeable future. SENSIO's solid balance sheet should be a big asset as it transitions from a concept/development company to a revenue generating company. The fact that they did the financing at $2.60/share is a huge bonus.
Live3D Events
This is an area where SENSIO's compression technology really shines. Broadcasting of live 3D events (such as FIFA, NBA, etc) must be done using the existing 2D infrastructure.
Existing spatial compression methods, such as side-by-side, send the left eye image to half of the screen and the right eye image to the other half. When the signal is received each half must then be stretched to fit the entire screen, reducing the resolution by 1/2. The result is a noticeably lower quality picture compared to the original.
What SENSIO does is compress and decode the signal, using their patented SENSIO Hi-Fi 3D technology, in a way that results in virtually zero noticeable picture loss, even when transmitted across existing 2D infrastructure.
This is why SENSIO is the leader in this area and was chosen to broadcast FIFA World Cup to 1,000 screens worldwide last year, and then chosen to broadcast numerous NBA games this year. This segment could see tremendous growth over the next couple of years, especially if the broadcasters are able to work out a revenue sharing deal with the television networks in the US.
Also In Q2...
- SENSIO will be attending NAB 2011 in April, where they will be demonstrating their new product offerings. NAB 2010 was where they announced their deal with FIFA last year, so I will be keeping my ears open for possible new deals to be announced during this time. The event runs Apr 9 - Apr 14.
- SENSIO has been working on a new website to better represent the company and better explain how their technologies work. I have seen the beta version of the site and must say it already looks 100 times better than their previous site. The new site is to be launched in early April.
- Look for new licensing agreements with major 3D TV manufacturers to incorporate SENSIO Hi-Fi 3D, Autodetect and S2D Switch into their televisions.
- Look for announcements for new Live 3D sporting events.
- Look for updated sales forecasts for the new line of SENSIO-enabled VIZIO 3D TVs.
What can I say? The share price has been a big disappointment so far this year.
Fundamentally I think the stock is a steal right here. The price isn't really much higher than it was a couple years ago - before Avatar was released, before 3D TVs were being produced, before live 3D sporting events were being broadcast in cinemas worldwide, before the successful $10 million financing, before SENSIO signed its agreement with VIZIO and before SENSIO introduced new patented technologies like Autodetect and S2D Switch.
Why this company is currently trading under a dollar I have no idea. The handful of analysts that cover the stock currently have 1-year price targets that range between 2.25 and 4.20 per share. Union Securities has also suggested that SENSIO is a potential takeover target. At under a dollar I could definitely see someone like RealD or even VIZIO looking to take them over at a bargain price.
Technically, today's closing price of .86 is just 2 cents shy of the 52-week low of .84. So far this .84-.86 has provided decent support, and if this level holds it could form the basis for a very strong double bottom.
If .84-.86 breaks then we could see a move down to as low as .70-.75 in the short-term. The fundamentals don't support a move lower in my opinion, but I can't rule it out. The stock is very illiquid and a few large sell orders could easily push the price lower. The flip-side, of course, is that once we hear some positive developments the price could just as easily jump by 40-50 cents with a few large buy orders.
My year-end target for the stock is 2.60-2.70, assuming we get some positive developments in Q2. Longer term, with a market cap of under $50 million, I think SIO.V has the potential to go much higher.

Thursday, March 31, 2011
Can Markets Rally On April Fools' Day?
The markets have been grinding higher over the last two weeks, breaking back up through several key technical indicators and frustrating the bears in the process.
Tomorrow begins the start of a new month, and a new quarter. And everyone is waiting for the big jobs number at 8:30am. The problem is I don't see how the market rallies tomorrow, no matter what the jobs number is.
The market is already feeling a little overbought in the short-term. So investors need a new catalyst to drive the market higher.
Let's look at 3 generic scenarios for tomorrow:
I scaled back a number of positions today, both long and short, but remain small net short going into tomorrow's number.
Tomorrow begins the start of a new month, and a new quarter. And everyone is waiting for the big jobs number at 8:30am. The problem is I don't see how the market rallies tomorrow, no matter what the jobs number is.
The market is already feeling a little overbought in the short-term. So investors need a new catalyst to drive the market higher.
Let's look at 3 generic scenarios for tomorrow:
- The number comes in on expectations. Under this scenario I expect to see a "sell the news" reaction. Many analysts have already ramped up their expectations for tomorrow. A good number is already priced in. If we see a strong number the natural reaction will be to lock in recent profits pushing the market lower.
- The number comes in much better than expected. Many would suggest that a much stronger number would result in a big rally (and in fact that is what many traders are betting on). But in my opinion a strong number will simply reinforce fears of no QE3 and result in a sell off in the market.
- The number comes in worse than expected. This, for me, is the trickiest scenario. On the one hand a weaker number should see selling as disappointed traders sell stocks they bought in anticipation of a good number. On the other hand, a weaker number will support calls for QE3 and may have the perverse effect of putting a bid to the market. I think the net effect will still be a negative, but my confidence level is lowest under this scenario.
I scaled back a number of positions today, both long and short, but remain small net short going into tomorrow's number.
Wednesday, March 30, 2011
How To Profit From Obama's Energy Policy
President Obama spoke at Georgetown University this morning on US energy policy. Obama vowed to cut US dependence on foreign oil by 1/3 over the next 10 years. The president plans to do this primarily through a combination of:

If you want to benefit from the longer-term expected rise in natural gas prices, I would rather play a name like Encana (ECA), or some of the better known shale plays like Petrohawk (HK), Devon (DVN) or Range Resources (RRC).

However, while warming up to natural gas, Obama is also talking tough on environmental concerns. This is a potential issue for the shale drillers. Hydraulic fracturing (fracking) involves pumping huge volumes of water, sand and chemicals at high pressures deep underground to break up rock formations to allow the gas to escape.
One company that may benefit from the increased environmental scrutiny is GasFrac Energy Services (GFS.V), a Canadian company with a proprietary fracking technology which is much more environmentally friendly than existing fracking methods. This investor presentation provides a nice summary. I picked up some shares in several accounts today at 12.46.

Obama also talked about using alternative fuels to power American vehicles. His plan includes stipulations that federal agencies buy only alternative fueled vehicles by 2015.
WPRT and CLNE both stand to benefit from a move toward natural gas powered vehicles. Both of these stocks have seen nice runs over the past 48-hours and rallied nicely ahead of the president's speech today. While technically they've both broken out, I used today's pop to take profit on CLNE and scale back my WPRT long by 50%. I'm looking for a move to 24.50 to cover the other 50% of WPRT.

Obama also specifically talked about electric cars and battery technologies as a key component of America's energy policy. Another Canadian company, Electrovaya (EFL.TO), not only develops proprietary electric car batteries but also batteries for electric power storage. Electricity storage will become more and more important as intermittent electricity sources such as wind generation grow as a percentage of total supply.
EFL.TO has a great long-term chart, with multi-year support in the 2.40-2.50 area on the weekly chart. I have been long this name for a while from around 2.65. I am looking for an eventual move to 6.50.

Ener1 (HEV) is another company in the battery sector which has been beaten down over the past couple months but looks like it could be putting in a bottom. I picked up a small number of shares today at 3.03.

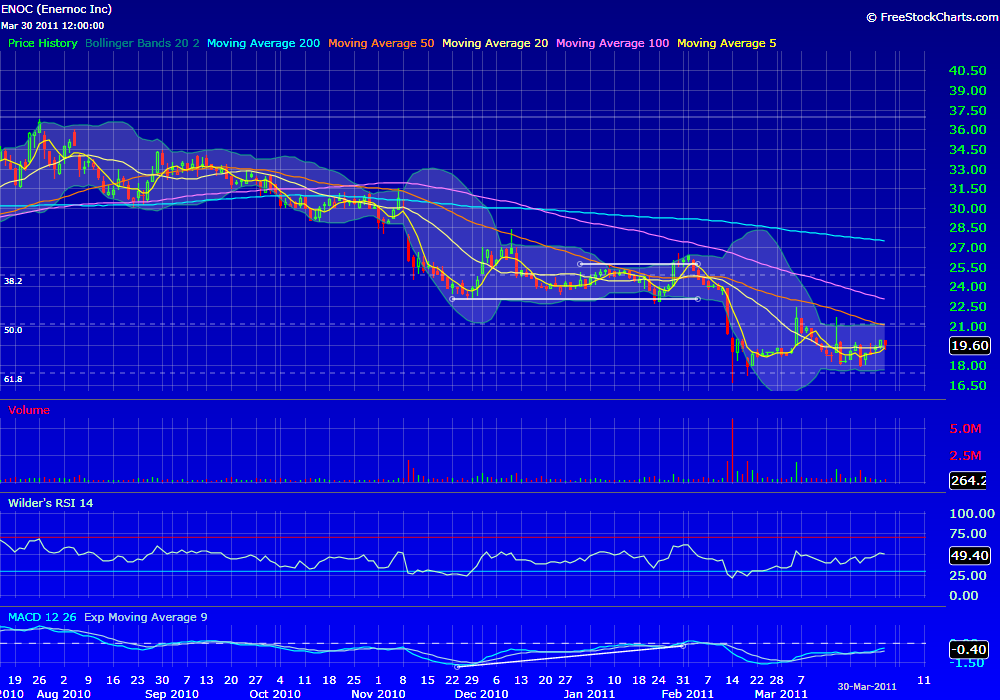
Finally, the president also stressed energy conservation in his speech. With the expectation for more and more electric cars to hit the roads in the coming years he talked about the increased need for electricity conservation. A company like EnerNOC (ENOC) is poised to benefit in this space. ENOC provides demand response and energy efficiency programs designed to reduce electricity usage. I went long ENOC today at 19.47.

- increased domestic drilling,
- alternative fuels, and
- electricity conservation.

If you want to benefit from the longer-term expected rise in natural gas prices, I would rather play a name like Encana (ECA), or some of the better known shale plays like Petrohawk (HK), Devon (DVN) or Range Resources (RRC).

However, while warming up to natural gas, Obama is also talking tough on environmental concerns. This is a potential issue for the shale drillers. Hydraulic fracturing (fracking) involves pumping huge volumes of water, sand and chemicals at high pressures deep underground to break up rock formations to allow the gas to escape.
One company that may benefit from the increased environmental scrutiny is GasFrac Energy Services (GFS.V), a Canadian company with a proprietary fracking technology which is much more environmentally friendly than existing fracking methods. This investor presentation provides a nice summary. I picked up some shares in several accounts today at 12.46.

Obama also talked about using alternative fuels to power American vehicles. His plan includes stipulations that federal agencies buy only alternative fueled vehicles by 2015.
WPRT and CLNE both stand to benefit from a move toward natural gas powered vehicles. Both of these stocks have seen nice runs over the past 48-hours and rallied nicely ahead of the president's speech today. While technically they've both broken out, I used today's pop to take profit on CLNE and scale back my WPRT long by 50%. I'm looking for a move to 24.50 to cover the other 50% of WPRT.

Obama also specifically talked about electric cars and battery technologies as a key component of America's energy policy. Another Canadian company, Electrovaya (EFL.TO), not only develops proprietary electric car batteries but also batteries for electric power storage. Electricity storage will become more and more important as intermittent electricity sources such as wind generation grow as a percentage of total supply.
EFL.TO has a great long-term chart, with multi-year support in the 2.40-2.50 area on the weekly chart. I have been long this name for a while from around 2.65. I am looking for an eventual move to 6.50.

Ener1 (HEV) is another company in the battery sector which has been beaten down over the past couple months but looks like it could be putting in a bottom. I picked up a small number of shares today at 3.03.

Finally, the president also stressed energy conservation in his speech. With the expectation for more and more electric cars to hit the roads in the coming years he talked about the increased need for electricity conservation. A company like EnerNOC (ENOC) is poised to benefit in this space. ENOC provides demand response and energy efficiency programs designed to reduce electricity usage. I went long ENOC today at 19.47.
Wednesday, March 23, 2011
Uranium Stocks - Oversold? Maybe. Undervalued? Not Even Close.
Frankly, I'm getting tired of hearing people come onto CNBC and talk about how the uranium sector is oversold and is a screaming buy here. Sure, the sector may be "oversold" by traditional terms. But just like a stock can keep rising while it is overbought (example: NFLX) there's no reason a stock has to bounce just because it is oversold. Especially when it has the burden of a near nuclear meltdown hanging over it.
I think what the bulls are forgetting is that the massive rise we saw in both uranium and uranium miners was based not only on existing and approved projects, but also on the prospects of a "nuclear revival" worldwide that would see a spike in new nuke applications and subsequent approvals. The last I heard Canada, Germany and even China have put a hold on all new nuclear applications until further safety studies can be completed.
Uranium prices were $40/lb just last summer and Cameco (CCJ) was trading in the low-$20's at the same time.
Exactly how is the nuclear industry 50% BETTER OFF than it was last summer?
From a technical perspective, what we witnessed in CCJ over the past 3 trading days is nothing more than a classic "dead cat bounce". Individual investors have bought into the oversold story, and some of the shorts that sold much higher are simply locking in profits. The little dip above the 200dma yesterday probably stopped out a few more shorts causing even more buying.

But none of that changes the bigger picture, which is that the sector is under a cloud of uncertainty, and prices are still about 50% higher than they were less than a year ago. That doesn't sound like a sound thesis for going long. There are still a lot of large investors that are long shares in CCJ from higher levels. They will see every bounce as an opportunity to sell. Technically I don't see how CCJ doesn't at a minimum go back to test the $21 level.
Sunday, March 20, 2011
Sunday Night Trading Thoughts
Last week was a crazy week. There was a lot going on, and definitely a lot of volatility in the markets.
As expected uranium and nuclear energy stocks got crushed. While I think some of the names in these sectors may be oversold I'm not ready to step in and buy them yet. Many companies charts, like Cameco (CCJ) are still broken and could have further to fall. CCJ might be worth a short if it gaps up on the open Monday.

The S&P500 actually held up fairly well for the week. And while it gave back a lot of its gains Friday afternoon, the index was only down about 2% for the week - which isn't bad all things considered. The fact the index was able to bounce back above its 100 day moving average is also encouraging in the short term.

With the US-led air campaign in Libya over the weekend pushing crude prices up over 2 bucks I would have expected stocks futures to have opened lower Sunday night, but S&P futures are currently up 8.50 points at 1282.75. The fact that futures are up given the weekend's events tells me the market went home short on Friday. This could lead to a bit of a short squeeze once the market opens Monday. I went long earlier tonight @ 1279 based on this view.
Currently it feels like the market wants to test 1300 in the S&P. At that point I will probably look to get short again. But right now it feels like maybe people are caught the wrong way. And any positive news out of Japan could spark further short covering in the short term.
Other specific sectors I like for this week are the golds, coal miners and the rare earths. I'll be looking at names like GLD, ABX and MCP as possible new longs.
I am already long WLT as a coal play. Coal should continue to get a boost as Japan looks for alternatives to replace its lost nuclear generation, and longer term as other countries reconsider the pace of new nuclear builds.
WLT looks to be forming a bull flag for an eventual move to new highs. Below 110 would reverse that view. Others in the coal sector I like include PCX and BTU. PCX is also in the process of forming a bull flag, while BTU is breaking out to new highs.

Wednesday, March 16, 2011
Weekly S&P Chart - Flash Crash Part II ?
The weekly RSI on the S&P 500 reached 76.17 less than a month ago. That was the most overbought the weekly RSI had been in almost 7 years.
Looking back to the beginning of 2008 there's only been one other instance where the weekly RSI breached the 70 level. That was in Apr/May 2010.
During the week ending Apr 30, 2010, after reaching a high of 72.62, the weekly RSI dipped back below 70 (the red line in the chart). The very next week the S&P suffered the flash crash (on Thursday, May 6, 2010), quickly losing 10% of it's value.

Fast forward less than a year later and, after hitting a high of 76.17, the weekly has RSI dipped back below the 70 level in an eerily similar fashion just this past week.
While I'm not suggesting we see a similar "flash crash" this week, I do think the chart is warning of a potential selloff in the very near future.
I have been short over the past 2 weeks and added to shorts this afternoon after the market bounced off its lows. If we get a dead cat bounce back to the 1300/1305 area this week I will look to add to short positions again. Above 1305 would force me to reconsider my view.
Tuesday, March 15, 2011
Really? Was That It?
After listening to the analysts on TV, and after reading all of the day's headlines, I would have thought that US stocks tanked by 10-20% today.
From my calculations, based on today's close, the S&P is only down 22 points or 1.7% since the Japanese earthquake hit. Even at its worst levels of the day it was only down 3.2% vs. Thursday's close. We've had bigger down days than that for less reason in the past.
Even prior to the earthquake the market was starting to look toppy and many of the market leaders' charts were starting to breakdown. We also still have that whole "Mideast thing" to deal with.
Add to these issues a massive earthquake, a tsunami, a Japanese stock market in free fall and a potential nuclear meltdown... and the result is a 2% correction in US stocks?
I think that investors are so conditioned to "buy the dip" that nobody actually sold anything to create a dip in the first place. Yet that didn't stop the the buyers from coming in and buying anyway.
So where does that leave us?
As far as I can figure it leaves us with a market that is more long today than it was just two days ago, and yet prices are only 1.7% lower.
It also leaves us with a market that is still both fundamentally and technically due for a significant correction.
So what will happen if/when the market corrects another 5-10% over the next few days or weeks? If the dip buyers already bought this week, will there be anyone left to buy the real dip when it comes? Even worse, will this week's dip buyers panic and sell during a real correction, causing the slide to worsen?
I can't help but think that the worst has yet to come...
"If you haven't sold already it's too late"
"Don't panic and sell"
"Buy the dip while others are panicking"
From my calculations, based on today's close, the S&P is only down 22 points or 1.7% since the Japanese earthquake hit. Even at its worst levels of the day it was only down 3.2% vs. Thursday's close. We've had bigger down days than that for less reason in the past.
Even prior to the earthquake the market was starting to look toppy and many of the market leaders' charts were starting to breakdown. We also still have that whole "Mideast thing" to deal with.
Add to these issues a massive earthquake, a tsunami, a Japanese stock market in free fall and a potential nuclear meltdown... and the result is a 2% correction in US stocks?
I think that investors are so conditioned to "buy the dip" that nobody actually sold anything to create a dip in the first place. Yet that didn't stop the the buyers from coming in and buying anyway.
So where does that leave us?
As far as I can figure it leaves us with a market that is more long today than it was just two days ago, and yet prices are only 1.7% lower.
It also leaves us with a market that is still both fundamentally and technically due for a significant correction.
So what will happen if/when the market corrects another 5-10% over the next few days or weeks? If the dip buyers already bought this week, will there be anyone left to buy the real dip when it comes? Even worse, will this week's dip buyers panic and sell during a real correction, causing the slide to worsen?
I can't help but think that the worst has yet to come...
Have You Made Your Wish List Yet?
I was going to go to bed early tonight, but a quick check of the markets showed Japan's Nikkei index down 1200 points, S&P futures down hard, crude back under 100 dollars and gold down over 10 bucks. And as I sat there staring at my trading screens things just went from bad to worse to "worser".
Anyone reading my recent posts, or my twitter feeds, know I have been negative on the market for the last couple weeks. The S&P has been turning lower, forming what looks like a "rounding top" over the last 2 weeks. The 20 day moving average (20dma) has turned lower. Price has closed under its 50dma in 2 out of the last 3 days. And the RSI and MACD have both been signaling lower prices.

I did not get aggressively short, but over the past couple weeks I've been slowly reducing longs, raising cash, and initiating new short positions. My trading account is small net short currently.
So assuming you have some cash on hand, what's the strategy here?
The type of price action we are experiencing tends to do a lot of damage to markets. There's no reason to rush in and buy the first dip you see, no matter how cheap a stock looks. This is not your typical run-of-the-mill correction. The Nikkei has suffered its worst 2-day loss since the 1970's and is now trading at its lowest levels since early 2009. S&P futures have reacted by selling off by over 2% tonight (although the futures have bounced off their lows somewhat).
What I would recommend is that everyone make a list of high quality stocks they wish to own, write them down, and then make note of key support levels that might provide attractive entry levels. Then look to either scale into the position, or just just place your bids at several support levels below the current price and sit back and wait. Patience will be key here.
For example, let's take a look at Apple (APPL):

AAPL is a company every likes, but many investors missed the last 80 dollar move over the past 6 months. AAPL closed @ 353.56 on Monday after bouncing off the 50dma support on Friday. Technically you would expect that the 50dma @ 346 would provide some support again. And it might, but in a market like this you need to be patient and wait for better risk/reward entry levels.
In the case of AAPL one strategy would be to layer into bids between 300-330. 280 is also a massive support level that one might consider. Alternatively you could just place a bid around 300 and hope that the market panics enough to get you filled.
There's no need to be a hero here. Just because you have the cash doesn't mean you have to buy anything at any price. Let the sellers come to you. But you need to be prepared as the best opportunities usually don't last long. You need to do your homework BEFORE the market opens and have your bids ready.
Earlier tonight I performed a number of scans and came up with a list of 15-20 stocks I would like to own at better levels. The list include companies like AAPL, IBM and ICE among others. Hopefully by the end of the week I will have been successful in buying a few of them at very attractive levels.
Sunday, March 13, 2011
The Nuclear Tsunami - Uranium Short Opportunity
The massive 8.9 magnitude earthquake and tsunami that struck Japan on Friday dealt a severe blow to the nuclear industry in Japan. Four nuclear power plants have been shut down, and at least one reactor is at risk of a full blown meltdown. Radiation has been leaking and the backup cooling systems are no longer operational. TEPCO, the nuclear operator, has resorted to pumping seawater as a last ditch effort to keep some of their reactors cooled. Over 200,000 people have been evacuated and a number of people have been exposed to harmful radiation levels.
The International Atomic Energy Agency (IAEA) has classified the incident as a 4 out of 7. However the potential still exists for that classification to rise. For comparison purposes, Three Mile Island (1979) was a 5 and Chernobyl (1986) was a 7.
I wrote on Friday about the impact of the plant shutdowns on global natural gas prices (The Natural Gas Tsunami). Japan's lost nuclear generation will have to made up primarily with natural gas. Since Japan imports virtually all of its natural gas, the demand for LNG and the price of global natural gas should both rise. Note that the one exception to this is US natural gas prices since the US imports very little LNG and has no existing capability to export it.
But what about the direct impact on the nuclear industry and on uranium itself?
For those investing in Japan, clearly TEPCO would be a company to avoid.
But the nuclear disaster in Japan also has some questioning the safety of nuclear generation here at home. There are currently 104 reactors operating in the US. And while no new plants have been commissioned in more than 30 years, there are currently 24 new plants in various stages of planning with the first expected to come on line in 2018. At a very minimum, these events will force a closer look at the design and safety of these new plants, as well as increased scrutiny toward all existing plants in the US. Sen. Joe Lieberman has already responded by saying that he believes the US should halt permits for new nuclear power plants until they can determine what went wrong in Japan.
Exelon (EXC) and Entergy (ETR) are the two largest nuclear operators in the US. While each of these stocks have shown decent gains year-to-date, they're both still trading near the lower end of multi-year ranges.
In the short-term these could be decent shorts for aggressive sellers. However, at first glance valuations for both EXC and ETR appear fairly reasonable vs. the S&P 500. Their p/e's are both between 10-11 and they're each yielding between 4.5-5.0%. I think each of these name could see a 5-10% drop from current levels, but I wouldn't necessarily be looking for a lot more out of the trade.
I like the idea of shorting the nuclear operators, but the better trade in my opinion would be shorting the uranium miners and/or uranium itself.
On Friday I sold two of my uranium holdings, both at small losses. I tweeted those trades at the time. The charts for most uranium companies had already begun weakening prior to the earthquake, with many already breaking below key support levels.
The price of uranium started coming off its highs in February on reports of several large sell orders after rising from about $40/lb to almost $75/lb in less than a year. Then in early March the US government announced it was planning to sell 4.2 million lbs of uranium from government stockpiles between 2011-2013. The spot price was last reported at $66.50/lb.
With the potential upside already likely capped in the short term, the nuclear shut downs in Japan now make a fairly strong case for a further drop in the price of both uranium and uranium miners. However Friday's reaction was interesting. Most of the uranium miners closed the day well off their lows with several names actually posting gains for the session. I think this provides an opportunity to short some of these companies with the potential for significant downside in price.
Some names to consider would be:
Cameco (CCJ, CCO.TO)
Paladin (PDN.TO)
Denison (DNN, DML.TO)
Uranium One (UUU.TO)
Ur-Energy (URE.TO)
Global X Uranium ETF (URA)
Friday, March 11, 2011
The Natural Gas Tsunami
The massive earthquake in Japan overnight has reportedly shut at least four nuclear plants in that country.
Japan already relies on LNG imports for virtually all of its natural gas generation needs. The loss of nuclear supply will result in even more LNG demand from Japan. I have heard early reports that they could end up importing an additional 4 or 5 LNG cargoes a month to make up for the lost generation. That has naturally caused global natural gas prices to rise overnight.
However, anybody who thinks that ANY of this will have ANY impact on supply/demand in the US will be very disappointed.
Historically there are several incidents we can look to for comparison. For example, a number of years ago Japan was forced to shut down several nuclear plants for an extended period for safety reasons. LNG was naturally used to make up the difference. The result was a jump in global natural gas prices and a subsequent rise in US natural gas prices.
The big difference between then and now is that prior to 2008/2009 the US was an importer of LNG to make up the difference between domestic supply and demand. So naturally when global LNG prices rose it had a direct impact on natural gas prices in the US.
Today, however, the US has an abundant supply of natural gas (simply Google "US natural gas shale" to learn why). And the impact of shale gas in the US has pushed prices so far below the rest of the world that the US now imports virtually zero LNG. Not only that, but the US also has virtually zero ability to export LNG.
As a result incidents that impact global natural gas prices have no impact on supply/demand in the US.
If anything, the earthquake in Japan will only serve to increase the spread between US and global natural gas prices. A better way to play this spread would be to invest in a company like Cheniere (LNG, CQP) that is in the process of building LNG export capabilities in the US.
A more immediate play would be to invest in a company like Golar LNG (GLNG) that ships LNG globally.
I am long LNG and GLNG.
tsunami
Thursday, March 10, 2011
Stay Short And Make A Shopping List
In yesterday's post, S&P 500 Chart - Depends On How You Look At It... , I talked about two specific possible outcomes for the S&P 500 (one bullish, one bearish). My view at the time was bearish, and that the S&P was forming a rounding top and was poised to break lower in the short-term.
The S&P 500 is currently trading down around 20 points at 1300, confirming the rounding top scenario in my opinion. We tested the Feb 24 lows @ 1294 earlier this am, and have so far held.

I am aware of the possibility that we could form a double bottom at 1294/1295, similar to what we saw back in November @ 1173. However I think there are a number of factors that will push the S&P below 1294/1295 in the near-term and eventually test the 1220/1230 level.
In addition to the unrest in the Mideast, seasonally we are coming up to a period that has not always been kind to stocks. I am also concerned about the amount of money that has come off the sidelines and into stocks over the past couple of months. That is never a good sign.
And the wild card, QE2, is scheduled to end in June. June is still a few months away, but the market will start discounting the removal of economic stimulus long before it actually happens. This week could be the beginning of that discounting.
Technically the RSI and MACD have turned lower, and a large number of market leaders' charts have begin to turn lower over the past week or so. Once 1294 gives way I am looking for an initial test of 1275, and then eventually 1220/1230.
This scenario suggests an additional 6% correction from current levels. As the market corrects I will have a shopping list of bargain stocks that I will start chipping away at. That shopping list will be the topic of a future post.
Now is not the time to start buying the dips.
Wednesday, March 9, 2011
S&P 500 Chart - Depends On How You Look At It...
Looking at the S&P 500 daily chart one could make an argument that it is in the midst of a nice pennant continuation pattern. A break above 1325/1330 would, under this view, confirm a breakout targeting new highs.

However, to me the chart looks more like it's putting in a rounding top formation. Interestingly, the same 1320/1325 level would invalidate that view should the S&P500 break above that level convincingly.


However, to me the chart looks more like it's putting in a rounding top formation. Interestingly, the same 1320/1325 level would invalidate that view should the S&P500 break above that level convincingly.

As I type this the S&P 500 is rallying, testing the 1323 level, getting very close to the 1325/1330 area. My view however is that we are in the midst of the 2nd scenario, the rounding top, and will fail resistance and sell off into the afternoon.
Fundamentally there are arguments on both side. Clearly the market is looking at easing oil prices as a reason to buy stocks. But the uncertainty in the mid-east is not going away. And seasonally as we get closer to the spring there are reasons to "sell and go away".
The market in my opinion is showing signs of weakening. I have been using the intraday bounce today to lighten up on longs that aren't performing, and put on new shorts. If the S&P fails to close above 1325/1330 I will likely add to these short positions.
If I am wrong and the S&P rallies into the afternoon then I will cover my S&P short positions but remain heavy in cash. I don't believe now is the time to be overweight equities.
Travelers Companies - A Decade Long Breakout
Traders spend a lot of time getting caught up in tick-by-tick price movements. But every now and then I like to step back and take a longer term view. I find using monthly charts work well for this purpose as they help me ignore the noise and see the bigger trend.
In the case of Travelers (TRV), looking at the daily chart shows a stock that has clearly been in an uptrend since last summer.

But almost every stock in the S&P500 has rallied since the summer. It's not until we take a look at a 10-year monthly chart that we can truly appreciate the significance of the break above the 57-58 level.

The break above 57-58 represents not only a break above the 57 high reached in 2007, but also the 57.50 high reached way back in 2000. It also confirms a monthly cup and handle breakout pattern.
I find these monthly breakout patterns to be much more reliable than shorter term breakouts, as more often than not they represent significant long-term positive developments within the company.
When seeing monthly breakout patterns like this you should only consider being long or flat the stock. There is nothing wrong with trying to trade around a long position like this, but shorting a stock in a major multi-year breakout is usually not a great risk/reward trade.
I went long TRV at 59.06 on Tuesday on the pullback from the 61.15 high seen in February. Technically the price could still pullback further to the 57-58 area without changing this bullish view. The long-term target is about 85 dollars.
I have seen a number of similar breakouts over the past month and will discuss some of them in a future blog post.
Tuesday, March 8, 2011
Cheniere Energy Rocked By 35.8% - Market Overreaction?
Update (Mar 9, 2011): I was informed by a colleague this morning that Dennis Gartman mentioned LNG in his Gartman Letter this morning (although not specifically by name). Gartman states that his source at the company is unequivocal that the claim against the company is baseless. Gartman goes on to say that he believes his source and that he is of the view that this is an "old-fashioned greenmail attempt". I respect Mr. Gartman's opinion and he is not one to make such statements lightly. I believe he is likely correct in his assessment.
------------------------------------------------------------------------------------------------------
Cheniere Energy (LNG) got absolutely rocked today, losing 35.8% of its market cap by the time the closing bell mercifully rang at 4pm.

Since October there have been 25 days where the daily range has exceeded 10% , 5 days where it exceeded 20% and 3 days where its exceeded 30%. For example, November 19 saw a 36.1% trading range as LNG broke above 5.40 to close at 6.16. Coincidentally 6.16 is within a few cents of today's 6.25 close.
So what caused today's sell-off?
Before the open Cheniere announced that they filed a lawsuit against Centerbridge PartnersLP, saying the distressed investment-focused hedge fund disrupted Cheniere’s business with a letter alleging it had defaulted on debt.
Cheniere carries a significant level of debt, and if the allegations are true it would not bode well for the company. But at this stage all we have are unfounded allegations by one hedge fund. And Cheniere responded to the allegations by suing Centerbridge for "defamation, business disparagement and tortuous interference with business relationships against it and its Sabine Pass unit".
I realize that in this market the natural reaction is to shoot first and ask questions later, but did today's news really merit a 35.8% loss of market cap? Only time will tell, but at this stage I have to wonder if the market is overreacting.
The fact still remains that North America is flush with natural gas. Even a brutally cold winter did little to cut into natural gas supplies. Yet natural gas prices around the world are significantly higher than they are in the US. The problem is that the US has virtually no capability to export natural gas currently. This is where Cheniere comes in.
Cheniere owns 91% of Sabine Pass, which operates a LNG import terminal on the border of Texas and Louisiana. Cheniere is in the process of building an export terminal along side its existing import terminal. The ability to export natural gas provides a huge opportunity for Cheniere - and it is this opportunity that has propelled Cheniere's stock price higher over the past 6 months.
The other thing to consider is that news of the lawsuit came out long before the market opened this morning. Yet there was little pre-market activity and after 2 hours of trading the stock was only down around 20 cents. Then shortly after noon the price fell below 9 dollars and just accelerated to the downside. This suggests to me that today's move was exaggerated as stops were triggered and as short sellers joined the party.

I was long this stock back in October at 2.70, bought and sold it a few times, and then took profit at 6.40 in February of this year. I then proceeded to miss an incredible 64% run over the following month as prices soared to a high of 10.53.
I see this as an opportunity to get back into a company with a great story and a great opportunity. Admittedly it's a high risk play, and I wouldn't recommend that anyone try to catch a falling knife in any stock unless they can handle the volatility. But I think the move is overdone, and was clearly accelerated by stops and short sellers.
I bought a few shares today at an average price of 7.43. I'm already down 15%, and there's a good chance the initial move tomorrow morning could be to try to push the stock lower again, but I think that the price could snap back very quickly once the selling calms down.
Also of note is that there was huge activity in the April 10 dollar calls today. 11.5k contracts were purchased, which is equal to about 15x the open interest. Somebody obviously thinks there's a chance this stock snaps back violently over the next month.
------------------------------------------------------------------------------------------------------
Cheniere Energy (LNG) got absolutely rocked today, losing 35.8% of its market cap by the time the closing bell mercifully rang at 4pm.

Clearly LNG is not immune to volatility. It broke out to the upside in October last year as it broke above the 3 dollar mark. Since that date there have been numerous high-volatile trading days.
So what caused today's sell-off?
Before the open Cheniere announced that they filed a lawsuit against Centerbridge PartnersLP, saying the distressed investment-focused hedge fund disrupted Cheniere’s business with a letter alleging it had defaulted on debt.
Cheniere carries a significant level of debt, and if the allegations are true it would not bode well for the company. But at this stage all we have are unfounded allegations by one hedge fund. And Cheniere responded to the allegations by suing Centerbridge for "defamation, business disparagement and tortuous interference with business relationships against it and its Sabine Pass unit".
I realize that in this market the natural reaction is to shoot first and ask questions later, but did today's news really merit a 35.8% loss of market cap? Only time will tell, but at this stage I have to wonder if the market is overreacting.
The fact still remains that North America is flush with natural gas. Even a brutally cold winter did little to cut into natural gas supplies. Yet natural gas prices around the world are significantly higher than they are in the US. The problem is that the US has virtually no capability to export natural gas currently. This is where Cheniere comes in.
Cheniere owns 91% of Sabine Pass, which operates a LNG import terminal on the border of Texas and Louisiana. Cheniere is in the process of building an export terminal along side its existing import terminal. The ability to export natural gas provides a huge opportunity for Cheniere - and it is this opportunity that has propelled Cheniere's stock price higher over the past 6 months.
The other thing to consider is that news of the lawsuit came out long before the market opened this morning. Yet there was little pre-market activity and after 2 hours of trading the stock was only down around 20 cents. Then shortly after noon the price fell below 9 dollars and just accelerated to the downside. This suggests to me that today's move was exaggerated as stops were triggered and as short sellers joined the party.
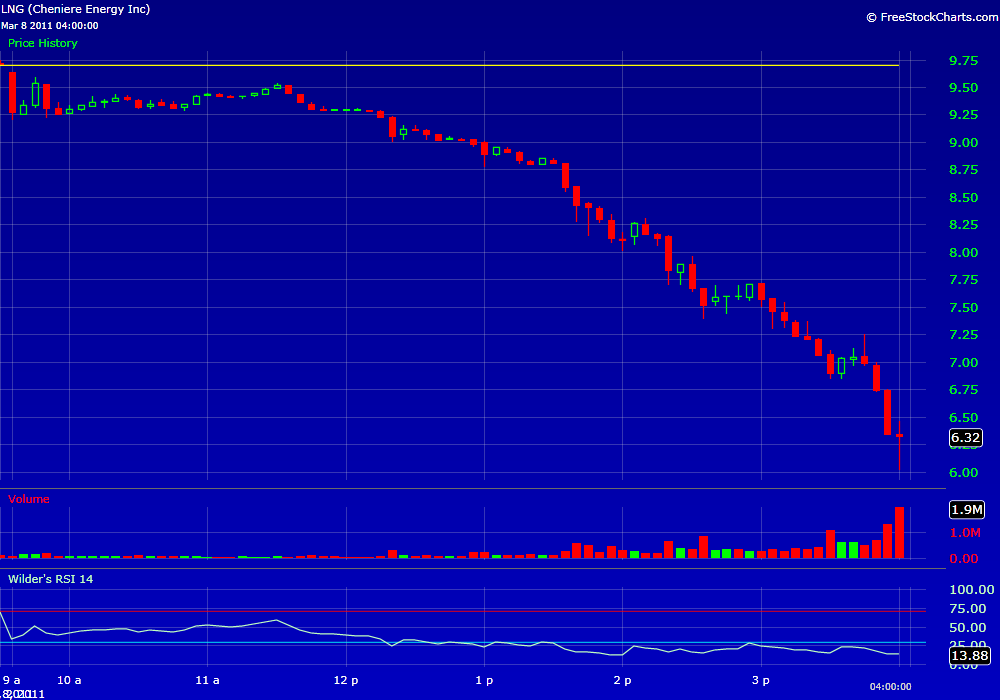
I was long this stock back in October at 2.70, bought and sold it a few times, and then took profit at 6.40 in February of this year. I then proceeded to miss an incredible 64% run over the following month as prices soared to a high of 10.53.
I see this as an opportunity to get back into a company with a great story and a great opportunity. Admittedly it's a high risk play, and I wouldn't recommend that anyone try to catch a falling knife in any stock unless they can handle the volatility. But I think the move is overdone, and was clearly accelerated by stops and short sellers.
I bought a few shares today at an average price of 7.43. I'm already down 15%, and there's a good chance the initial move tomorrow morning could be to try to push the stock lower again, but I think that the price could snap back very quickly once the selling calms down.
Also of note is that there was huge activity in the April 10 dollar calls today. 11.5k contracts were purchased, which is equal to about 15x the open interest. Somebody obviously thinks there's a chance this stock snaps back violently over the next month.
Subscribe to:
Posts (Atom)