The weekly RSI on the S&P 500 reached 76.17 less than a month ago. That was the most overbought the weekly RSI had been in almost 7 years.
Looking back to the beginning of 2008 there's only been one other instance where the weekly RSI breached the 70 level. That was in Apr/May 2010.
During the week ending Apr 30, 2010, after reaching a high of 72.62, the weekly RSI dipped back below 70 (the red line in the chart). The very next week the S&P suffered the flash crash (on Thursday, May 6, 2010), quickly losing 10% of it's value.
Fast forward less than a year later and, after hitting a high of 76.17, the weekly has RSI dipped back below the 70 level in an eerily similar fashion just this past week.
While I'm not suggesting we see a similar "flash crash" this week, I do think the chart is warning of a potential selloff in the very near future.
I have been short over the past 2 weeks and added to shorts this afternoon after the market bounced off its lows. If we get a dead cat bounce back to the 1300/1305 area this week I will look to add to short positions again. Above 1305 would force me to reconsider my view.
Wednesday, March 16, 2011
Tuesday, March 15, 2011
Really? Was That It?
After listening to the analysts on TV, and after reading all of the day's headlines, I would have thought that US stocks tanked by 10-20% today.
From my calculations, based on today's close, the S&P is only down 22 points or 1.7% since the Japanese earthquake hit. Even at its worst levels of the day it was only down 3.2% vs. Thursday's close. We've had bigger down days than that for less reason in the past.
Even prior to the earthquake the market was starting to look toppy and many of the market leaders' charts were starting to breakdown. We also still have that whole "Mideast thing" to deal with.
Add to these issues a massive earthquake, a tsunami, a Japanese stock market in free fall and a potential nuclear meltdown... and the result is a 2% correction in US stocks?
I think that investors are so conditioned to "buy the dip" that nobody actually sold anything to create a dip in the first place. Yet that didn't stop the the buyers from coming in and buying anyway.
So where does that leave us?
As far as I can figure it leaves us with a market that is more long today than it was just two days ago, and yet prices are only 1.7% lower.
It also leaves us with a market that is still both fundamentally and technically due for a significant correction.
So what will happen if/when the market corrects another 5-10% over the next few days or weeks? If the dip buyers already bought this week, will there be anyone left to buy the real dip when it comes? Even worse, will this week's dip buyers panic and sell during a real correction, causing the slide to worsen?
I can't help but think that the worst has yet to come...
"If you haven't sold already it's too late"
"Don't panic and sell"
"Buy the dip while others are panicking"
From my calculations, based on today's close, the S&P is only down 22 points or 1.7% since the Japanese earthquake hit. Even at its worst levels of the day it was only down 3.2% vs. Thursday's close. We've had bigger down days than that for less reason in the past.
Even prior to the earthquake the market was starting to look toppy and many of the market leaders' charts were starting to breakdown. We also still have that whole "Mideast thing" to deal with.
Add to these issues a massive earthquake, a tsunami, a Japanese stock market in free fall and a potential nuclear meltdown... and the result is a 2% correction in US stocks?
I think that investors are so conditioned to "buy the dip" that nobody actually sold anything to create a dip in the first place. Yet that didn't stop the the buyers from coming in and buying anyway.
So where does that leave us?
As far as I can figure it leaves us with a market that is more long today than it was just two days ago, and yet prices are only 1.7% lower.
It also leaves us with a market that is still both fundamentally and technically due for a significant correction.
So what will happen if/when the market corrects another 5-10% over the next few days or weeks? If the dip buyers already bought this week, will there be anyone left to buy the real dip when it comes? Even worse, will this week's dip buyers panic and sell during a real correction, causing the slide to worsen?
I can't help but think that the worst has yet to come...
Have You Made Your Wish List Yet?
I was going to go to bed early tonight, but a quick check of the markets showed Japan's Nikkei index down 1200 points, S&P futures down hard, crude back under 100 dollars and gold down over 10 bucks. And as I sat there staring at my trading screens things just went from bad to worse to "worser".
Anyone reading my recent posts, or my twitter feeds, know I have been negative on the market for the last couple weeks. The S&P has been turning lower, forming what looks like a "rounding top" over the last 2 weeks. The 20 day moving average (20dma) has turned lower. Price has closed under its 50dma in 2 out of the last 3 days. And the RSI and MACD have both been signaling lower prices.
I did not get aggressively short, but over the past couple weeks I've been slowly reducing longs, raising cash, and initiating new short positions. My trading account is small net short currently.
So assuming you have some cash on hand, what's the strategy here?
The type of price action we are experiencing tends to do a lot of damage to markets. There's no reason to rush in and buy the first dip you see, no matter how cheap a stock looks. This is not your typical run-of-the-mill correction. The Nikkei has suffered its worst 2-day loss since the 1970's and is now trading at its lowest levels since early 2009. S&P futures have reacted by selling off by over 2% tonight (although the futures have bounced off their lows somewhat).
What I would recommend is that everyone make a list of high quality stocks they wish to own, write them down, and then make note of key support levels that might provide attractive entry levels. Then look to either scale into the position, or just just place your bids at several support levels below the current price and sit back and wait. Patience will be key here.
For example, let's take a look at Apple (APPL):
AAPL is a company every likes, but many investors missed the last 80 dollar move over the past 6 months. AAPL closed @ 353.56 on Monday after bouncing off the 50dma support on Friday. Technically you would expect that the 50dma @ 346 would provide some support again. And it might, but in a market like this you need to be patient and wait for better risk/reward entry levels.
In the case of AAPL one strategy would be to layer into bids between 300-330. 280 is also a massive support level that one might consider. Alternatively you could just place a bid around 300 and hope that the market panics enough to get you filled.
There's no need to be a hero here. Just because you have the cash doesn't mean you have to buy anything at any price. Let the sellers come to you. But you need to be prepared as the best opportunities usually don't last long. You need to do your homework BEFORE the market opens and have your bids ready.
Earlier tonight I performed a number of scans and came up with a list of 15-20 stocks I would like to own at better levels. The list include companies like AAPL, IBM and ICE among others. Hopefully by the end of the week I will have been successful in buying a few of them at very attractive levels.
Anyone reading my recent posts, or my twitter feeds, know I have been negative on the market for the last couple weeks. The S&P has been turning lower, forming what looks like a "rounding top" over the last 2 weeks. The 20 day moving average (20dma) has turned lower. Price has closed under its 50dma in 2 out of the last 3 days. And the RSI and MACD have both been signaling lower prices.
I did not get aggressively short, but over the past couple weeks I've been slowly reducing longs, raising cash, and initiating new short positions. My trading account is small net short currently.
So assuming you have some cash on hand, what's the strategy here?
The type of price action we are experiencing tends to do a lot of damage to markets. There's no reason to rush in and buy the first dip you see, no matter how cheap a stock looks. This is not your typical run-of-the-mill correction. The Nikkei has suffered its worst 2-day loss since the 1970's and is now trading at its lowest levels since early 2009. S&P futures have reacted by selling off by over 2% tonight (although the futures have bounced off their lows somewhat).
What I would recommend is that everyone make a list of high quality stocks they wish to own, write them down, and then make note of key support levels that might provide attractive entry levels. Then look to either scale into the position, or just just place your bids at several support levels below the current price and sit back and wait. Patience will be key here.
For example, let's take a look at Apple (APPL):
AAPL is a company every likes, but many investors missed the last 80 dollar move over the past 6 months. AAPL closed @ 353.56 on Monday after bouncing off the 50dma support on Friday. Technically you would expect that the 50dma @ 346 would provide some support again. And it might, but in a market like this you need to be patient and wait for better risk/reward entry levels.
In the case of AAPL one strategy would be to layer into bids between 300-330. 280 is also a massive support level that one might consider. Alternatively you could just place a bid around 300 and hope that the market panics enough to get you filled.
There's no need to be a hero here. Just because you have the cash doesn't mean you have to buy anything at any price. Let the sellers come to you. But you need to be prepared as the best opportunities usually don't last long. You need to do your homework BEFORE the market opens and have your bids ready.
Earlier tonight I performed a number of scans and came up with a list of 15-20 stocks I would like to own at better levels. The list include companies like AAPL, IBM and ICE among others. Hopefully by the end of the week I will have been successful in buying a few of them at very attractive levels.
Sunday, March 13, 2011
The Nuclear Tsunami - Uranium Short Opportunity
The massive 8.9 magnitude earthquake and tsunami that struck Japan on Friday dealt a severe blow to the nuclear industry in Japan. Four nuclear power plants have been shut down, and at least one reactor is at risk of a full blown meltdown. Radiation has been leaking and the backup cooling systems are no longer operational. TEPCO, the nuclear operator, has resorted to pumping seawater as a last ditch effort to keep some of their reactors cooled. Over 200,000 people have been evacuated and a number of people have been exposed to harmful radiation levels.
The International Atomic Energy Agency (IAEA) has classified the incident as a 4 out of 7. However the potential still exists for that classification to rise. For comparison purposes, Three Mile Island (1979) was a 5 and Chernobyl (1986) was a 7.
I wrote on Friday about the impact of the plant shutdowns on global natural gas prices (The Natural Gas Tsunami). Japan's lost nuclear generation will have to made up primarily with natural gas. Since Japan imports virtually all of its natural gas, the demand for LNG and the price of global natural gas should both rise. Note that the one exception to this is US natural gas prices since the US imports very little LNG and has no existing capability to export it.
But what about the direct impact on the nuclear industry and on uranium itself?
For those investing in Japan, clearly TEPCO would be a company to avoid.
But the nuclear disaster in Japan also has some questioning the safety of nuclear generation here at home. There are currently 104 reactors operating in the US. And while no new plants have been commissioned in more than 30 years, there are currently 24 new plants in various stages of planning with the first expected to come on line in 2018. At a very minimum, these events will force a closer look at the design and safety of these new plants, as well as increased scrutiny toward all existing plants in the US. Sen. Joe Lieberman has already responded by saying that he believes the US should halt permits for new nuclear power plants until they can determine what went wrong in Japan.
Exelon (EXC) and Entergy (ETR) are the two largest nuclear operators in the US. While each of these stocks have shown decent gains year-to-date, they're both still trading near the lower end of multi-year ranges.
In the short-term these could be decent shorts for aggressive sellers. However, at first glance valuations for both EXC and ETR appear fairly reasonable vs. the S&P 500. Their p/e's are both between 10-11 and they're each yielding between 4.5-5.0%. I think each of these name could see a 5-10% drop from current levels, but I wouldn't necessarily be looking for a lot more out of the trade.
I like the idea of shorting the nuclear operators, but the better trade in my opinion would be shorting the uranium miners and/or uranium itself.
On Friday I sold two of my uranium holdings, both at small losses. I tweeted those trades at the time. The charts for most uranium companies had already begun weakening prior to the earthquake, with many already breaking below key support levels.
The price of uranium started coming off its highs in February on reports of several large sell orders after rising from about $40/lb to almost $75/lb in less than a year. Then in early March the US government announced it was planning to sell 4.2 million lbs of uranium from government stockpiles between 2011-2013. The spot price was last reported at $66.50/lb.
With the potential upside already likely capped in the short term, the nuclear shut downs in Japan now make a fairly strong case for a further drop in the price of both uranium and uranium miners. However Friday's reaction was interesting. Most of the uranium miners closed the day well off their lows with several names actually posting gains for the session. I think this provides an opportunity to short some of these companies with the potential for significant downside in price.
Some names to consider would be:
Cameco (CCJ, CCO.TO)
Paladin (PDN.TO)
Denison (DNN, DML.TO)
Uranium One (UUU.TO)
Ur-Energy (URE.TO)
Global X Uranium ETF (URA)
The International Atomic Energy Agency (IAEA) has classified the incident as a 4 out of 7. However the potential still exists for that classification to rise. For comparison purposes, Three Mile Island (1979) was a 5 and Chernobyl (1986) was a 7.
I wrote on Friday about the impact of the plant shutdowns on global natural gas prices (The Natural Gas Tsunami). Japan's lost nuclear generation will have to made up primarily with natural gas. Since Japan imports virtually all of its natural gas, the demand for LNG and the price of global natural gas should both rise. Note that the one exception to this is US natural gas prices since the US imports very little LNG and has no existing capability to export it.
But what about the direct impact on the nuclear industry and on uranium itself?
For those investing in Japan, clearly TEPCO would be a company to avoid.
But the nuclear disaster in Japan also has some questioning the safety of nuclear generation here at home. There are currently 104 reactors operating in the US. And while no new plants have been commissioned in more than 30 years, there are currently 24 new plants in various stages of planning with the first expected to come on line in 2018. At a very minimum, these events will force a closer look at the design and safety of these new plants, as well as increased scrutiny toward all existing plants in the US. Sen. Joe Lieberman has already responded by saying that he believes the US should halt permits for new nuclear power plants until they can determine what went wrong in Japan.
Exelon (EXC) and Entergy (ETR) are the two largest nuclear operators in the US. While each of these stocks have shown decent gains year-to-date, they're both still trading near the lower end of multi-year ranges.
In the short-term these could be decent shorts for aggressive sellers. However, at first glance valuations for both EXC and ETR appear fairly reasonable vs. the S&P 500. Their p/e's are both between 10-11 and they're each yielding between 4.5-5.0%. I think each of these name could see a 5-10% drop from current levels, but I wouldn't necessarily be looking for a lot more out of the trade.
I like the idea of shorting the nuclear operators, but the better trade in my opinion would be shorting the uranium miners and/or uranium itself.
On Friday I sold two of my uranium holdings, both at small losses. I tweeted those trades at the time. The charts for most uranium companies had already begun weakening prior to the earthquake, with many already breaking below key support levels.
The price of uranium started coming off its highs in February on reports of several large sell orders after rising from about $40/lb to almost $75/lb in less than a year. Then in early March the US government announced it was planning to sell 4.2 million lbs of uranium from government stockpiles between 2011-2013. The spot price was last reported at $66.50/lb.
With the potential upside already likely capped in the short term, the nuclear shut downs in Japan now make a fairly strong case for a further drop in the price of both uranium and uranium miners. However Friday's reaction was interesting. Most of the uranium miners closed the day well off their lows with several names actually posting gains for the session. I think this provides an opportunity to short some of these companies with the potential for significant downside in price.
Some names to consider would be:
Cameco (CCJ, CCO.TO)
Paladin (PDN.TO)
Denison (DNN, DML.TO)
Uranium One (UUU.TO)
Ur-Energy (URE.TO)
Global X Uranium ETF (URA)
Friday, March 11, 2011
The Natural Gas Tsunami
The massive earthquake in Japan overnight has reportedly shut at least four nuclear plants in that country.
Japan already relies on LNG imports for virtually all of its natural gas generation needs. The loss of nuclear supply will result in even more LNG demand from Japan. I have heard early reports that they could end up importing an additional 4 or 5 LNG cargoes a month to make up for the lost generation. That has naturally caused global natural gas prices to rise overnight.
However, anybody who thinks that ANY of this will have ANY impact on supply/demand in the US will be very disappointed.
Historically there are several incidents we can look to for comparison. For example, a number of years ago Japan was forced to shut down several nuclear plants for an extended period for safety reasons. LNG was naturally used to make up the difference. The result was a jump in global natural gas prices and a subsequent rise in US natural gas prices.
The big difference between then and now is that prior to 2008/2009 the US was an importer of LNG to make up the difference between domestic supply and demand. So naturally when global LNG prices rose it had a direct impact on natural gas prices in the US.
Today, however, the US has an abundant supply of natural gas (simply Google "US natural gas shale" to learn why). And the impact of shale gas in the US has pushed prices so far below the rest of the world that the US now imports virtually zero LNG. Not only that, but the US also has virtually zero ability to export LNG.
As a result incidents that impact global natural gas prices have no impact on supply/demand in the US.
If anything, the earthquake in Japan will only serve to increase the spread between US and global natural gas prices. A better way to play this spread would be to invest in a company like Cheniere (LNG, CQP) that is in the process of building LNG export capabilities in the US.
A more immediate play would be to invest in a company like Golar LNG (GLNG) that ships LNG globally.
I am long LNG and GLNG.
tsunami
Japan already relies on LNG imports for virtually all of its natural gas generation needs. The loss of nuclear supply will result in even more LNG demand from Japan. I have heard early reports that they could end up importing an additional 4 or 5 LNG cargoes a month to make up for the lost generation. That has naturally caused global natural gas prices to rise overnight.
However, anybody who thinks that ANY of this will have ANY impact on supply/demand in the US will be very disappointed.
Historically there are several incidents we can look to for comparison. For example, a number of years ago Japan was forced to shut down several nuclear plants for an extended period for safety reasons. LNG was naturally used to make up the difference. The result was a jump in global natural gas prices and a subsequent rise in US natural gas prices.
The big difference between then and now is that prior to 2008/2009 the US was an importer of LNG to make up the difference between domestic supply and demand. So naturally when global LNG prices rose it had a direct impact on natural gas prices in the US.
Today, however, the US has an abundant supply of natural gas (simply Google "US natural gas shale" to learn why). And the impact of shale gas in the US has pushed prices so far below the rest of the world that the US now imports virtually zero LNG. Not only that, but the US also has virtually zero ability to export LNG.
As a result incidents that impact global natural gas prices have no impact on supply/demand in the US.
If anything, the earthquake in Japan will only serve to increase the spread between US and global natural gas prices. A better way to play this spread would be to invest in a company like Cheniere (LNG, CQP) that is in the process of building LNG export capabilities in the US.
A more immediate play would be to invest in a company like Golar LNG (GLNG) that ships LNG globally.
I am long LNG and GLNG.
tsunami
Thursday, March 10, 2011
Stay Short And Make A Shopping List
In yesterday's post, S&P 500 Chart - Depends On How You Look At It... , I talked about two specific possible outcomes for the S&P 500 (one bullish, one bearish). My view at the time was bearish, and that the S&P was forming a rounding top and was poised to break lower in the short-term.
The S&P 500 is currently trading down around 20 points at 1300, confirming the rounding top scenario in my opinion. We tested the Feb 24 lows @ 1294 earlier this am, and have so far held.
I am aware of the possibility that we could form a double bottom at 1294/1295, similar to what we saw back in November @ 1173. However I think there are a number of factors that will push the S&P below 1294/1295 in the near-term and eventually test the 1220/1230 level.
In addition to the unrest in the Mideast, seasonally we are coming up to a period that has not always been kind to stocks. I am also concerned about the amount of money that has come off the sidelines and into stocks over the past couple of months. That is never a good sign.
And the wild card, QE2, is scheduled to end in June. June is still a few months away, but the market will start discounting the removal of economic stimulus long before it actually happens. This week could be the beginning of that discounting.
Technically the RSI and MACD have turned lower, and a large number of market leaders' charts have begin to turn lower over the past week or so. Once 1294 gives way I am looking for an initial test of 1275, and then eventually 1220/1230.
This scenario suggests an additional 6% correction from current levels. As the market corrects I will have a shopping list of bargain stocks that I will start chipping away at. That shopping list will be the topic of a future post.
Now is not the time to start buying the dips.
The S&P 500 is currently trading down around 20 points at 1300, confirming the rounding top scenario in my opinion. We tested the Feb 24 lows @ 1294 earlier this am, and have so far held.
I am aware of the possibility that we could form a double bottom at 1294/1295, similar to what we saw back in November @ 1173. However I think there are a number of factors that will push the S&P below 1294/1295 in the near-term and eventually test the 1220/1230 level.
In addition to the unrest in the Mideast, seasonally we are coming up to a period that has not always been kind to stocks. I am also concerned about the amount of money that has come off the sidelines and into stocks over the past couple of months. That is never a good sign.
And the wild card, QE2, is scheduled to end in June. June is still a few months away, but the market will start discounting the removal of economic stimulus long before it actually happens. This week could be the beginning of that discounting.
Technically the RSI and MACD have turned lower, and a large number of market leaders' charts have begin to turn lower over the past week or so. Once 1294 gives way I am looking for an initial test of 1275, and then eventually 1220/1230.
This scenario suggests an additional 6% correction from current levels. As the market corrects I will have a shopping list of bargain stocks that I will start chipping away at. That shopping list will be the topic of a future post.
Now is not the time to start buying the dips.
Wednesday, March 9, 2011
S&P 500 Chart - Depends On How You Look At It...
Looking at the S&P 500 daily chart one could make an argument that it is in the midst of a nice pennant continuation pattern. A break above 1325/1330 would, under this view, confirm a breakout targeting new highs.
However, to me the chart looks more like it's putting in a rounding top formation. Interestingly, the same 1320/1325 level would invalidate that view should the S&P500 break above that level convincingly.
As I type this the S&P 500 is rallying, testing the 1323 level, getting very close to the 1325/1330 area. My view however is that we are in the midst of the 2nd scenario, the rounding top, and will fail resistance and sell off into the afternoon.
Fundamentally there are arguments on both side. Clearly the market is looking at easing oil prices as a reason to buy stocks. But the uncertainty in the mid-east is not going away. And seasonally as we get closer to the spring there are reasons to "sell and go away".
The market in my opinion is showing signs of weakening. I have been using the intraday bounce today to lighten up on longs that aren't performing, and put on new shorts. If the S&P fails to close above 1325/1330 I will likely add to these short positions.
If I am wrong and the S&P rallies into the afternoon then I will cover my S&P short positions but remain heavy in cash. I don't believe now is the time to be overweight equities.
Travelers Companies - A Decade Long Breakout
Traders spend a lot of time getting caught up in tick-by-tick price movements. But every now and then I like to step back and take a longer term view. I find using monthly charts work well for this purpose as they help me ignore the noise and see the bigger trend.
In the case of Travelers (TRV), looking at the daily chart shows a stock that has clearly been in an uptrend since last summer.
But almost every stock in the S&P500 has rallied since the summer. It's not until we take a look at a 10-year monthly chart that we can truly appreciate the significance of the break above the 57-58 level.
The break above 57-58 represents not only a break above the 57 high reached in 2007, but also the 57.50 high reached way back in 2000. It also confirms a monthly cup and handle breakout pattern.
I find these monthly breakout patterns to be much more reliable than shorter term breakouts, as more often than not they represent significant long-term positive developments within the company.
When seeing monthly breakout patterns like this you should only consider being long or flat the stock. There is nothing wrong with trying to trade around a long position like this, but shorting a stock in a major multi-year breakout is usually not a great risk/reward trade.
I went long TRV at 59.06 on Tuesday on the pullback from the 61.15 high seen in February. Technically the price could still pullback further to the 57-58 area without changing this bullish view. The long-term target is about 85 dollars.
I have seen a number of similar breakouts over the past month and will discuss some of them in a future blog post.
In the case of Travelers (TRV), looking at the daily chart shows a stock that has clearly been in an uptrend since last summer.
But almost every stock in the S&P500 has rallied since the summer. It's not until we take a look at a 10-year monthly chart that we can truly appreciate the significance of the break above the 57-58 level.
The break above 57-58 represents not only a break above the 57 high reached in 2007, but also the 57.50 high reached way back in 2000. It also confirms a monthly cup and handle breakout pattern.
I find these monthly breakout patterns to be much more reliable than shorter term breakouts, as more often than not they represent significant long-term positive developments within the company.
When seeing monthly breakout patterns like this you should only consider being long or flat the stock. There is nothing wrong with trying to trade around a long position like this, but shorting a stock in a major multi-year breakout is usually not a great risk/reward trade.
I went long TRV at 59.06 on Tuesday on the pullback from the 61.15 high seen in February. Technically the price could still pullback further to the 57-58 area without changing this bullish view. The long-term target is about 85 dollars.
I have seen a number of similar breakouts over the past month and will discuss some of them in a future blog post.
Tuesday, March 8, 2011
Cheniere Energy Rocked By 35.8% - Market Overreaction?
Update (Mar 9, 2011): I was informed by a colleague this morning that Dennis Gartman mentioned LNG in his Gartman Letter this morning (although not specifically by name). Gartman states that his source at the company is unequivocal that the claim against the company is baseless. Gartman goes on to say that he believes his source and that he is of the view that this is an "old-fashioned greenmail attempt". I respect Mr. Gartman's opinion and he is not one to make such statements lightly. I believe he is likely correct in his assessment.
------------------------------------------------------------------------------------------------------
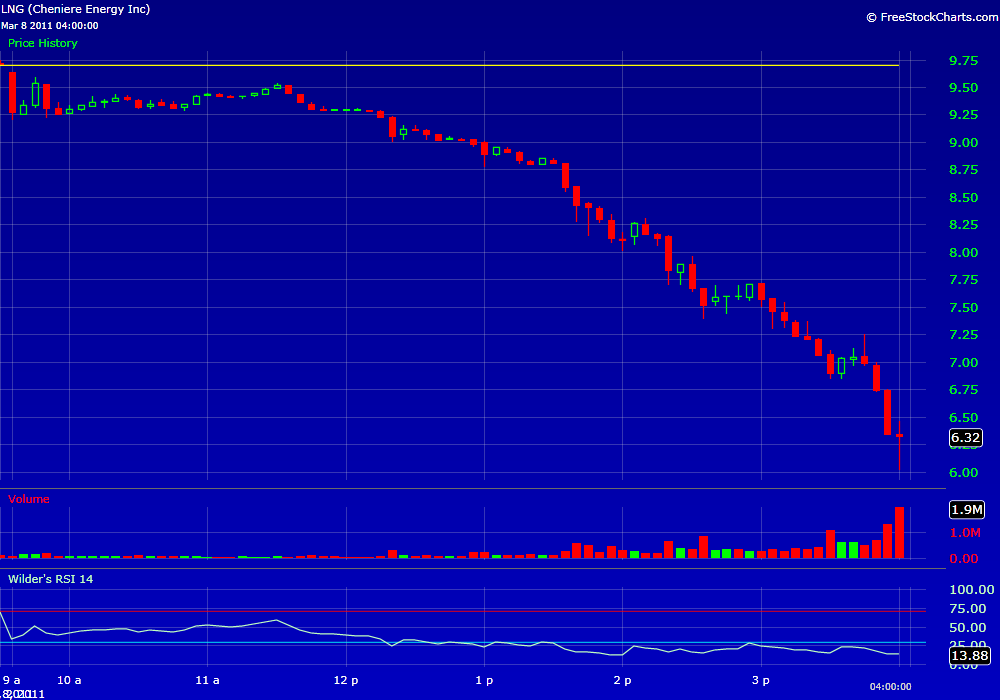
Cheniere Energy (LNG) got absolutely rocked today, losing 35.8% of its market cap by the time the closing bell mercifully rang at 4pm.
Since October there have been 25 days where the daily range has exceeded 10% , 5 days where it exceeded 20% and 3 days where its exceeded 30%. For example, November 19 saw a 36.1% trading range as LNG broke above 5.40 to close at 6.16. Coincidentally 6.16 is within a few cents of today's 6.25 close.
So what caused today's sell-off?
Before the open Cheniere announced that they filed a lawsuit against Centerbridge PartnersLP, saying the distressed investment-focused hedge fund disrupted Cheniere’s business with a letter alleging it had defaulted on debt.
Cheniere carries a significant level of debt, and if the allegations are true it would not bode well for the company. But at this stage all we have are unfounded allegations by one hedge fund. And Cheniere responded to the allegations by suing Centerbridge for "defamation, business disparagement and tortuous interference with business relationships against it and its Sabine Pass unit".
I realize that in this market the natural reaction is to shoot first and ask questions later, but did today's news really merit a 35.8% loss of market cap? Only time will tell, but at this stage I have to wonder if the market is overreacting.
The fact still remains that North America is flush with natural gas. Even a brutally cold winter did little to cut into natural gas supplies. Yet natural gas prices around the world are significantly higher than they are in the US. The problem is that the US has virtually no capability to export natural gas currently. This is where Cheniere comes in.
Cheniere owns 91% of Sabine Pass, which operates a LNG import terminal on the border of Texas and Louisiana. Cheniere is in the process of building an export terminal along side its existing import terminal. The ability to export natural gas provides a huge opportunity for Cheniere - and it is this opportunity that has propelled Cheniere's stock price higher over the past 6 months.
The other thing to consider is that news of the lawsuit came out long before the market opened this morning. Yet there was little pre-market activity and after 2 hours of trading the stock was only down around 20 cents. Then shortly after noon the price fell below 9 dollars and just accelerated to the downside. This suggests to me that today's move was exaggerated as stops were triggered and as short sellers joined the party.
I was long this stock back in October at 2.70, bought and sold it a few times, and then took profit at 6.40 in February of this year. I then proceeded to miss an incredible 64% run over the following month as prices soared to a high of 10.53.
I see this as an opportunity to get back into a company with a great story and a great opportunity. Admittedly it's a high risk play, and I wouldn't recommend that anyone try to catch a falling knife in any stock unless they can handle the volatility. But I think the move is overdone, and was clearly accelerated by stops and short sellers.
I bought a few shares today at an average price of 7.43. I'm already down 15%, and there's a good chance the initial move tomorrow morning could be to try to push the stock lower again, but I think that the price could snap back very quickly once the selling calms down.
Also of note is that there was huge activity in the April 10 dollar calls today. 11.5k contracts were purchased, which is equal to about 15x the open interest. Somebody obviously thinks there's a chance this stock snaps back violently over the next month.
------------------------------------------------------------------------------------------------------
Cheniere Energy (LNG) got absolutely rocked today, losing 35.8% of its market cap by the time the closing bell mercifully rang at 4pm.
Clearly LNG is not immune to volatility. It broke out to the upside in October last year as it broke above the 3 dollar mark. Since that date there have been numerous high-volatile trading days.
So what caused today's sell-off?
Before the open Cheniere announced that they filed a lawsuit against Centerbridge PartnersLP, saying the distressed investment-focused hedge fund disrupted Cheniere’s business with a letter alleging it had defaulted on debt.
Cheniere carries a significant level of debt, and if the allegations are true it would not bode well for the company. But at this stage all we have are unfounded allegations by one hedge fund. And Cheniere responded to the allegations by suing Centerbridge for "defamation, business disparagement and tortuous interference with business relationships against it and its Sabine Pass unit".
I realize that in this market the natural reaction is to shoot first and ask questions later, but did today's news really merit a 35.8% loss of market cap? Only time will tell, but at this stage I have to wonder if the market is overreacting.
The fact still remains that North America is flush with natural gas. Even a brutally cold winter did little to cut into natural gas supplies. Yet natural gas prices around the world are significantly higher than they are in the US. The problem is that the US has virtually no capability to export natural gas currently. This is where Cheniere comes in.
Cheniere owns 91% of Sabine Pass, which operates a LNG import terminal on the border of Texas and Louisiana. Cheniere is in the process of building an export terminal along side its existing import terminal. The ability to export natural gas provides a huge opportunity for Cheniere - and it is this opportunity that has propelled Cheniere's stock price higher over the past 6 months.
The other thing to consider is that news of the lawsuit came out long before the market opened this morning. Yet there was little pre-market activity and after 2 hours of trading the stock was only down around 20 cents. Then shortly after noon the price fell below 9 dollars and just accelerated to the downside. This suggests to me that today's move was exaggerated as stops were triggered and as short sellers joined the party.
I was long this stock back in October at 2.70, bought and sold it a few times, and then took profit at 6.40 in February of this year. I then proceeded to miss an incredible 64% run over the following month as prices soared to a high of 10.53.
I see this as an opportunity to get back into a company with a great story and a great opportunity. Admittedly it's a high risk play, and I wouldn't recommend that anyone try to catch a falling knife in any stock unless they can handle the volatility. But I think the move is overdone, and was clearly accelerated by stops and short sellers.
I bought a few shares today at an average price of 7.43. I'm already down 15%, and there's a good chance the initial move tomorrow morning could be to try to push the stock lower again, but I think that the price could snap back very quickly once the selling calms down.
Also of note is that there was huge activity in the April 10 dollar calls today. 11.5k contracts were purchased, which is equal to about 15x the open interest. Somebody obviously thinks there's a chance this stock snaps back violently over the next month.
Monday, March 7, 2011
Natural Gas - Sell The Bounce (Again)
In a recent post, Natural Gas: Weekly Storage Analysis and More, I highlighted several fundamental reasons to be bullish natgas at some point over the next couple of months. The key phrase here is "at some point".
All of those reasons I mentioned in that post are still valid. And at some point natgas will stage an explosive rally, squeezing the shorts for 20-25% in the matter of a day or two. The question is does that rally start from 3.80? Or 3.20? Or even lower?
The prompt contract certainly put in an impressive performance today, rallying as much as 5.5% from the overnight low of 3.73 to a high of 3.93.
However 3.93 puts the contract right up against the declining trendline that's been in place since January. Until this trendline is broken, and quite frankly until price starts to trade back up above its 50 and 200 day moving averages, the odds still favour selling rallies.
The UNG chart looks even worse, with multiple levels of resistance between 5.20-5.30 including a declining trendline, the 20 day moving average and the Oct 2010 low. There are some possible bullish signs, such as the RSI and the MACD starting to turn up, but I think it's more than likely that this rally fails like every other attempt so far this year. And with a stop above 5.30 a short offers great risk/reward here with an inital target around 4.75.
Now I've read some forecasts calling for a colder than normal spring, but winter is basically over. And while supplies are not at record levels I suspect that without frigid cold temperatures (like we experienced this winter) driving demand we could start to see some fairly bearish storage numbers released by the EIA over the next several weeks.
As well, the NOAA forecasts for the 6-10 day and 8-14 day periods show warmer-than-normal temperatures in the northeast US which is a big driver of heating demand in the winter.

I went long the leveraged natural gas bear ETF HND.TO @ 10.06 this afternoon. This trade, like a short in UNG, offers a great risk/reward profile with a stop above the 20 day moving average.
All of those reasons I mentioned in that post are still valid. And at some point natgas will stage an explosive rally, squeezing the shorts for 20-25% in the matter of a day or two. The question is does that rally start from 3.80? Or 3.20? Or even lower?
The prompt contract certainly put in an impressive performance today, rallying as much as 5.5% from the overnight low of 3.73 to a high of 3.93.
However 3.93 puts the contract right up against the declining trendline that's been in place since January. Until this trendline is broken, and quite frankly until price starts to trade back up above its 50 and 200 day moving averages, the odds still favour selling rallies.
The UNG chart looks even worse, with multiple levels of resistance between 5.20-5.30 including a declining trendline, the 20 day moving average and the Oct 2010 low. There are some possible bullish signs, such as the RSI and the MACD starting to turn up, but I think it's more than likely that this rally fails like every other attempt so far this year. And with a stop above 5.30 a short offers great risk/reward here with an inital target around 4.75.
Now I've read some forecasts calling for a colder than normal spring, but winter is basically over. And while supplies are not at record levels I suspect that without frigid cold temperatures (like we experienced this winter) driving demand we could start to see some fairly bearish storage numbers released by the EIA over the next several weeks.
As well, the NOAA forecasts for the 6-10 day and 8-14 day periods show warmer-than-normal temperatures in the northeast US which is a big driver of heating demand in the winter.

I went long the leveraged natural gas bear ETF HND.TO @ 10.06 this afternoon. This trade, like a short in UNG, offers a great risk/reward profile with a stop above the 20 day moving average.
Alert - AOL Breaks Under 20.00 Key Support
Inverted cup and handle. Break below 20 initially targets 18-18.25. I highlighted this short in my previous blog post, 3 Bearish Chart Ideas For Friday, but unfortunately took profits on Friday afternoon @ 20.08 for a +1.04 gain ahead of the weekend. Will be watching for an opportunity to put short back on.
Friday, March 4, 2011
3 Bearish Chart Ideas For Friday
AOL: Inverted cup and handle. Break below 20 targets 18-18.25. Still short from 21.12.
ABX: Island gap reversal off multi-year resistance between 54-56. Fundamentally I don't agree with the short, but will be interesting to watch for confirmation tomorrow. Closing the gap @ 53.35 would invalidate the reversal signal. No position.
AMZN: Can look to sell under 175 for a test of 155-160. Use 100 day ma @ 175 as a pivot. Above 175 targets 180. No position.
ABX: Island gap reversal off multi-year resistance between 54-56. Fundamentally I don't agree with the short, but will be interesting to watch for confirmation tomorrow. Closing the gap @ 53.35 would invalidate the reversal signal. No position.
AMZN: Can look to sell under 175 for a test of 155-160. Use 100 day ma @ 175 as a pivot. Above 175 targets 180. No position.
Thursday, March 3, 2011
6 Bullish Chart Ideas For Friday
COHR: This stock is a machine. Looks ready to bust above 62.25-62.50 for a test of 67. No position.
EFL.TO: Monthly chart. Love to see breakouts of multi-year highs. Should be massive support in that whole 2.25-2.50 area. Held 50dma today @ 2.52. I am long between 2.65-2.70 in LT account. Target 5.50. Stop under 2.20. Interesting battery play marketing to both electric vehicles and power storage.
ENS: Great chart. I should be long. Target 41. Stop under 33.70. No position.
IBM: Rock solid support @ 159. Look for break above 166 to target 173. I like the idea of being long right here. No position.
ICE: Great setup here. Look for break above 130 to target 140. Recent spike in oil prices should be good for revenues. Potential takeover target. No position.
SNE: Bullish. Nice setup. Look for break above 37 to target 40 initially. Went long today @ 36.37. Stop under 35.50.
EFL.TO: Monthly chart. Love to see breakouts of multi-year highs. Should be massive support in that whole 2.25-2.50 area. Held 50dma today @ 2.52. I am long between 2.65-2.70 in LT account. Target 5.50. Stop under 2.20. Interesting battery play marketing to both electric vehicles and power storage.
ENS: Great chart. I should be long. Target 41. Stop under 33.70. No position.
IBM: Rock solid support @ 159. Look for break above 166 to target 173. I like the idea of being long right here. No position.
ICE: Great setup here. Look for break above 130 to target 140. Recent spike in oil prices should be good for revenues. Potential takeover target. No position.
SNE: Bullish. Nice setup. Look for break above 37 to target 40 initially. Went long today @ 36.37. Stop under 35.50.
Natural Gas: Weekly Storage Analysis
Natural gas inventories declined by 85 bcf for the week ended Feb 25. This was in-line with market expectations and compares to a draw of 81 bcf last week. The same period last year saw a decline of 124 bcf. The 5-year average is -130 bcf.
As a result, the storage deficit vs. both last year and the 5-year average narrowed.
Total working gas in storage now stands at 1,745 bcf, only 9 bcf less than last year, and 15 bcf below the 5-year average.
With storage levels sitting right near the 5-year average, there remains ample storage to meet current demand. And production continues to be strong, more than offsetting any weather-related demand.
Currently, many forecasters are calling for a colder-than-normal spring. However if the cool weather fails to spur additional heating demand, or if the cool weather does not materialize as expected, there is risk of excess supply pushing spot prices even lower.
As I stated in last week's post, Natural Gas: Weekly Storage Analysis and More, there are many reasons to be bullish at some point between now and late spring. But now does not appear to be the time.
Technically, natural gas posted an evening star reversal last week following the bounce off the 3.80 level. Spot prices now look poised to test the 3.50 level.
As a result, the storage deficit vs. both last year and the 5-year average narrowed.
Total working gas in storage now stands at 1,745 bcf, only 9 bcf less than last year, and 15 bcf below the 5-year average.
With storage levels sitting right near the 5-year average, there remains ample storage to meet current demand. And production continues to be strong, more than offsetting any weather-related demand.
Currently, many forecasters are calling for a colder-than-normal spring. However if the cool weather fails to spur additional heating demand, or if the cool weather does not materialize as expected, there is risk of excess supply pushing spot prices even lower.
As I stated in last week's post, Natural Gas: Weekly Storage Analysis and More, there are many reasons to be bullish at some point between now and late spring. But now does not appear to be the time.
Technically, natural gas posted an evening star reversal last week following the bounce off the 3.80 level. Spot prices now look poised to test the 3.50 level.
Wednesday, March 2, 2011
Voodoo Statistics Part 2 - The Jan-Feb Effect
A few days ago all anyone could talk about was how stocks were virtually guaranteed to go up on the first day of the month. After all, the first trading day for the S&P 500 had been positive for 7 straight months, and 14 out of last 16 months (88% of the time!).
Well we all know what happened on February 1. And hopefully those that read my blog First Trading Day Of The Month - Voodoo Statistics had the sense to protect themselves in case things didn't go according to plan.
Now I'm hearing a lot of folks talk about the Jan-Feb effect, that is when the stock market rises in January and February the market almost always closes higher for the entire year. One study states that since 1938, when the S&P 500 rose in January and February (as it has this year), the index went on to close higher for the entire year 25 out of 26 times. This stat was referenced in Eddy Elfenbein's blog Crossing Wallstreet earlier today. (Note: I am not picking on Mr. Elfenbein in any way, just referencing where I got the data. This stat has also been discussed endlessly on CNBC and elsewhere)
I don't actually have the raw data going back to 1938, but I do have the data going back to 1970. So let's take a look and see what the data actually says:
Since 1970 (41 years), the S&P 500 has been positive in both Jan and Feb 22 times. Of those 22 years, the market went on to close positive 21 times. That seems pretty consistent with the stats referenced above. 21 out of 22, or 95% of the time, the market closed the year higher.
Sweet! Let's mortgage the house and buy high-beta stocks on margin then!
Ok seriously, 95% does sound impressive. And in some ways it is. But let's put the number in proper perspective before we all go out and buy stocks like drunken sailors.
First off, for those 22 years in question, the market averaged gains of 6.3% in the first two months. This year the S&P 500 "only" gained 5.5% in the first 2 months. What if instead we asked the question, "what happens in years where the market gains less than 6% during the first two months?". Certainly that is not any more arbitrary than the original question posted above?
As it turns out the S&P 500 has averaged gains of less than 6% in January and February in 30 out of the last 41 years. And in those years the market went on to post positive gains just 21 out of 30 times. That's only 70% of the time compared to 95% mentioned above. Furthermore in those 30 years the market ended up averaging gains of just 3.5% for the entire year.
Another thing to consider is that since 1970 the market has been up 31 out of 41 years (76% of the time) no matter how January or February fared. Historically stock markets go up. That will put a positive bias on any study.
The point of the above is that data can be sliced and diced in an infinite number of ways and can be made to say almost anything you want it to. And like anything in life, past returns are no guarantee of future results. We certainly saw that on February 1 this year.
Well we all know what happened on February 1. And hopefully those that read my blog First Trading Day Of The Month - Voodoo Statistics had the sense to protect themselves in case things didn't go according to plan.
Now I'm hearing a lot of folks talk about the Jan-Feb effect, that is when the stock market rises in January and February the market almost always closes higher for the entire year. One study states that since 1938, when the S&P 500 rose in January and February (as it has this year), the index went on to close higher for the entire year 25 out of 26 times. This stat was referenced in Eddy Elfenbein's blog Crossing Wallstreet earlier today. (Note: I am not picking on Mr. Elfenbein in any way, just referencing where I got the data. This stat has also been discussed endlessly on CNBC and elsewhere)
I don't actually have the raw data going back to 1938, but I do have the data going back to 1970. So let's take a look and see what the data actually says:
Since 1970 (41 years), the S&P 500 has been positive in both Jan and Feb 22 times. Of those 22 years, the market went on to close positive 21 times. That seems pretty consistent with the stats referenced above. 21 out of 22, or 95% of the time, the market closed the year higher.
Sweet! Let's mortgage the house and buy high-beta stocks on margin then!
Ok seriously, 95% does sound impressive. And in some ways it is. But let's put the number in proper perspective before we all go out and buy stocks like drunken sailors.
First off, for those 22 years in question, the market averaged gains of 6.3% in the first two months. This year the S&P 500 "only" gained 5.5% in the first 2 months. What if instead we asked the question, "what happens in years where the market gains less than 6% during the first two months?". Certainly that is not any more arbitrary than the original question posted above?
As it turns out the S&P 500 has averaged gains of less than 6% in January and February in 30 out of the last 41 years. And in those years the market went on to post positive gains just 21 out of 30 times. That's only 70% of the time compared to 95% mentioned above. Furthermore in those 30 years the market ended up averaging gains of just 3.5% for the entire year.
Another thing to consider is that since 1970 the market has been up 31 out of 41 years (76% of the time) no matter how January or February fared. Historically stock markets go up. That will put a positive bias on any study.
The point of the above is that data can be sliced and diced in an infinite number of ways and can be made to say almost anything you want it to. And like anything in life, past returns are no guarantee of future results. We certainly saw that on February 1 this year.
Surviving A Day Like Tuesday
What happened? Yesterday was the first day of the month, right? Wasn't that supposed to guarantee easy money for everyone who was long?
In my last post, First Trading Day Of The Month - Voodoo Statistics, I warned of the potential for a 22.5 point loss in the S&P on Monday. The S&P actually ended up dropping 20.9 points or -1.6%. Those who hedged themselves to prepare for such a move would have done well yesterday.
Personally I think the drop we had on Feb 22 was the beginning of a more sustained down move in equities. We had a nice bounce late last week. But even as the S&P was bouncing, lots of the market leaders continued to show relative weakness. Names like NFLX and AMZN for example continued to hit new recent lows even as the market bounced.
Other names like GS are just now starting to break down below uptrends that have been in place since last summer.
On Tuesday I added to my S&P shorts in the morning as the markets initially rallied. And initiated short positions in AOL, GSIC and GS.
I covered my natural gas long for flat. I bought natgas via $HNU.TO near the lows last week, rode it all the way up, and all the way back down again. I'm not particularly proud of that trade. I thought that natgas was putting in a floor and had more room to rally, but ignored both Monday's hammer and the support/resistance level put in during the end of December.
Based on the UNG chart above, natural gas confirmed resistance around the 5.50 level and put in a brutal evening star reversal. While fundamentally many of the bullish arguments I made in Natural Gas: Weekly Storage Analysis and More are still valid, the technicals are suggesting it still may too early to commit to a long position here. However I'll be watching for signs to get back in.
I am also short EUR/USD @ around 1.3800 via EUO. This is a bit of a risky play, but I think provides good risk/reward with the massive negative USD sentiment in the market. But I will stop myself out of that position on a move above 1.3900.
For the balance of the week my plan is to remain short equities until something tells me I'm wrong. Initial support in the S&P comes in at 1290/12.95 today with stronger support around 1275. If 1275 gives way then I could see the S&P falling all the way to 1220/1225 before stabilizing.
In my last post, First Trading Day Of The Month - Voodoo Statistics, I warned of the potential for a 22.5 point loss in the S&P on Monday. The S&P actually ended up dropping 20.9 points or -1.6%. Those who hedged themselves to prepare for such a move would have done well yesterday.
Personally I think the drop we had on Feb 22 was the beginning of a more sustained down move in equities. We had a nice bounce late last week. But even as the S&P was bouncing, lots of the market leaders continued to show relative weakness. Names like NFLX and AMZN for example continued to hit new recent lows even as the market bounced.
Other names like GS are just now starting to break down below uptrends that have been in place since last summer.
On Tuesday I added to my S&P shorts in the morning as the markets initially rallied. And initiated short positions in AOL, GSIC and GS.
I covered my natural gas long for flat. I bought natgas via $HNU.TO near the lows last week, rode it all the way up, and all the way back down again. I'm not particularly proud of that trade. I thought that natgas was putting in a floor and had more room to rally, but ignored both Monday's hammer and the support/resistance level put in during the end of December.
Based on the UNG chart above, natural gas confirmed resistance around the 5.50 level and put in a brutal evening star reversal. While fundamentally many of the bullish arguments I made in Natural Gas: Weekly Storage Analysis and More are still valid, the technicals are suggesting it still may too early to commit to a long position here. However I'll be watching for signs to get back in.
I am also short EUR/USD @ around 1.3800 via EUO. This is a bit of a risky play, but I think provides good risk/reward with the massive negative USD sentiment in the market. But I will stop myself out of that position on a move above 1.3900.
For the balance of the week my plan is to remain short equities until something tells me I'm wrong. Initial support in the S&P comes in at 1290/12.95 today with stronger support around 1275. If 1275 gives way then I could see the S&P falling all the way to 1220/1225 before stabilizing.
I will also be keeping an eye on oil prices. A sudden drop in oil prices could cause equities to quickly reverse and move higher (at least in the short term), but as long as we are flirting with triple-digit oil in the current environment I like staying short.
Monday, February 28, 2011
First Trading Day Of The Month - Voodoo Statistics
Here's a few quick stats...
Another way to look at things is that if you average the first day of the month with the last day of the preceding month, the average gain has only been 0.2% over the last 23 months. Considering the S&P posted a gain of 0.6% today, statistically we should be looking for a loss of 0.4% tomorrow, or about 5.5 points on the S&P.
Alternatively I suppose you could just flip a coin. But I've got my S&P hedges on just in case...
- The first trading day of the month has been positive for the last 7 consecutive months.
- 19 out of the last 23 months (83% of the time) the first trading day has been positive.
- Of those 19 days the average gain has been 1.3% in the S&P 500.
- Once every joker running a free blog is aware of a trend, the trend just might be over.
- Of the 4 out of the last 23 months where the first trading day was NOT positive, the average loss was 1.7% in the S&P 500.
- The pattern over the past 23 months has gone: 5 UP, 2 DOWN, 7 UP, 2 DOWN, 7 UP (I don't have data beyond 23 months, so the initial 5 UP could actually be greater - I don't know).
Another way to look at things is that if you average the first day of the month with the last day of the preceding month, the average gain has only been 0.2% over the last 23 months. Considering the S&P posted a gain of 0.6% today, statistically we should be looking for a loss of 0.4% tomorrow, or about 5.5 points on the S&P.
Alternatively I suppose you could just flip a coin. But I've got my S&P hedges on just in case...
Sunday, February 27, 2011
Natural Gas: Weekly Storage Analysis and More
Natural gas inventories declined by 81 bcf for the week ended Feb 18. Near record temperatures observed in the northeast during the latter part of the week saw demand for natural gas weaken during the reporting period.
While inventory levels remain healthy, it's a refreshing change to see inventory levels no longer nearing or making new record highs. Part of the credit certainly goes to the cold winter we've experienced so far this year. I'll need to do some additional research to see what other factors may be impacting the supply/demand balance, but there are some signs that industrial demand may finally be picking up a little.
Technically, the natural gas contract put in a big reversal off the lows on Friday. And the fact that natural gas was unable to sustain any kind of move lower after the -81 bcf release on Thursday has to be looked at as bullish. From a risk/reward perspective, I like the idea of playing natural gas from the long side over the next couple of months as long as last week's low holds.
I remain long HNU.TO from 4.92 and HK from 20.45. I took some profits on 25-30% of these positions on Friday to reduce the risk a little and improve my average, but I think the chances are good they both see much higher prices over the next couple of months. I also particularly like DVN and may look to initiate a position in the 88-89 area if I get a chance this week.
The 81 bcf draw compares to a draw of 233 bcf in the previous week. The same period last year saw a decline of 175 bcf, while the 5-year average is decline of 149 bcf.
Total working gas in storage now stands at 1,830 bcf, 48 bcf less that where we were at this point last year, and 61 bcf below the 5-year average.
While inventory levels remain healthy, it's a refreshing change to see inventory levels no longer nearing or making new record highs. Part of the credit certainly goes to the cold winter we've experienced so far this year. I'll need to do some additional research to see what other factors may be impacting the supply/demand balance, but there are some signs that industrial demand may finally be picking up a little.
And while natural gas prices still remain stubbornly near multi-year lows, there are a number of fundamental factors in favour of the bulls:
- Market sentiment remains solidly bearish.
- All things being equal, triple-digit oil prices make current natural gas look cheap on an equivalent-BTU basis.
- Inventory levels are no longer at record high levels.
- The 2011 Hurricane Season is only 3 short months away, and early forecasts are calling for a 40% increase in Atlantic hurricane activity vs. the norm. See Tropical Storm Risk for the full forecast.
- Longer term, the possible role that natural gas might play in North America's energy plan needs to be considered.
- Finally, look at natural gas names like ECA, HK, DVN, CHK, SWN, RRC. All of these stocks have been rallying even as natural gas prices are near recent lows. That alone tells me we are not going to see a 2-handle on natural gas prices as some are predicting.
Technically, the natural gas contract put in a big reversal off the lows on Friday. And the fact that natural gas was unable to sustain any kind of move lower after the -81 bcf release on Thursday has to be looked at as bullish. From a risk/reward perspective, I like the idea of playing natural gas from the long side over the next couple of months as long as last week's low holds.
I remain long HNU.TO from 4.92 and HK from 20.45. I took some profits on 25-30% of these positions on Friday to reduce the risk a little and improve my average, but I think the chances are good they both see much higher prices over the next couple of months. I also particularly like DVN and may look to initiate a position in the 88-89 area if I get a chance this week.
UPDATE: Clean Energy - Last Year's Trade?
My original post was written Feb 13, 2011, shortly after Congress proposed deep cuts to clean energy funding.
At the time of writing, there were no near term catalysts that were expected to give clean energy any type of boost. However shortly after writing the article Libya blew up and WTI oil prices subsequently spiked. Triple-digit oil prices suddenly make alternative energy plays like CLNE or WPRT much more attractive.
Those who follow me on Twitter were notified when I covered my shorts in WPRT and CLNE. On Feb 17 I covered my WPRT short @ 15.81 for a 8 cent loss and on feb 18 I covered my CLNE short @ 11.96 for a 12 cent profit. Within days both of these stocks screamed higher along with global energy prices.
Chart: WPRT
I was fortunate enough to cover my short positions in each of these stocks, which saved me from substantial losses.
This highlights 2 important lessons:
At the time of writing, there were no near term catalysts that were expected to give clean energy any type of boost. However shortly after writing the article Libya blew up and WTI oil prices subsequently spiked. Triple-digit oil prices suddenly make alternative energy plays like CLNE or WPRT much more attractive.
Those who follow me on Twitter were notified when I covered my shorts in WPRT and CLNE. On Feb 17 I covered my WPRT short @ 15.81 for a 8 cent loss and on feb 18 I covered my CLNE short @ 11.96 for a 12 cent profit. Within days both of these stocks screamed higher along with global energy prices.
Chart: WPRT
Chart: CLNE
I was fortunate enough to cover my short positions in each of these stocks, which saved me from substantial losses.
This highlights 2 important lessons:
- Never become married to a position or a trading strategy.
- When the fundamentals or the technicals change - get out of the position.
Friday Recap - A Much Better Day
I posted on Thursday that I had my worst trading day in recent memory.
I didn't make any major mistakes, the market wasn't crashing, and my positions were fairly well diversified. It just so happened that virtually EVERY long and short position I had was down a couple percent or more. Statistically that is just going to happen every now and again. As a result I suffered a loss of almost 3% of my entire portfolio.
I reacted the only way I could, I cut back a few positions on Thursday to reduce my overall risk.
It's amazing how much of a difference a day can make. Friday saw my entire portfolio recoup about 2/3 of Thursday's losses - even after closing some positions on Thursday for losses. My trading accounts actually recouped 100% of their losses (some of the longer-term accounts were still down a little over the 2 days).
The lesson here is, when the markets are kicking you in the teeth don't panic and don't try and make it all back in one day. The worst thing you can do is double up and add to a losing situation. Almost as bad is to panic and sell everything you hold.
By cutting back on some positions that were bleeding, I was able to increase my cash position enough to feel comfortable initiating new trades in HK and HNU.TO later in the day. Those two trades were up 6.0% and 7.1% respectively on Friday.
The end result is I'm back to being in the black for the month, and my streak of 9 consecutive winning months appears to be intact.
I didn't make any major mistakes, the market wasn't crashing, and my positions were fairly well diversified. It just so happened that virtually EVERY long and short position I had was down a couple percent or more. Statistically that is just going to happen every now and again. As a result I suffered a loss of almost 3% of my entire portfolio.
I reacted the only way I could, I cut back a few positions on Thursday to reduce my overall risk.
It's amazing how much of a difference a day can make. Friday saw my entire portfolio recoup about 2/3 of Thursday's losses - even after closing some positions on Thursday for losses. My trading accounts actually recouped 100% of their losses (some of the longer-term accounts were still down a little over the 2 days).
The lesson here is, when the markets are kicking you in the teeth don't panic and don't try and make it all back in one day. The worst thing you can do is double up and add to a losing situation. Almost as bad is to panic and sell everything you hold.
By cutting back on some positions that were bleeding, I was able to increase my cash position enough to feel comfortable initiating new trades in HK and HNU.TO later in the day. Those two trades were up 6.0% and 7.1% respectively on Friday.
The end result is I'm back to being in the black for the month, and my streak of 9 consecutive winning months appears to be intact.
Subscribe to:
Posts (Atom)